. 2015 Aug 21;6(24):20043-57.
doi: 10.18632/oncotarget.4994.

Survivin co-ordinates formation of follicular T-cells acting in synergy with Bcl-6

Affiliations

Survivin co-ordinates formation of follicular T-cells acting in synergy with Bcl-6

Karin M E Andersson et al. Oncotarget. .

Abstract

Follicular T helper (Tfh) cells are recognized by the expression of CXCR5 and the transcriptional regulator Bcl-6. Tfh cells control B cell maturation and antibody production, and if deregulated, may lead to autoimmunity. Here, we study the role of the proto-oncogene survivin in the formation of Tfh cells. We show that blood Tfh cells of patients with the autoimmune condition rheumatoid arthritis, have intracellular expression of survivin. Survivin was co-localized with Bcl-6 in the nuclei of CXCR5+CD4 lymphocytes and was immunoprecipitated with the Bcl-6 responsive element of the target genes. Inhibition of survivin in arthritic mice led to the reduction of CXCR5+ Tfh cells and to low production of autoantibodies. Exposure to survivin activated STAT3 and induced enrichment of PD-1+Bcl-6+ subset within Tfh cells. Collectively, our study demonstrates that survivin belongs to the Tfh cell phenotype and ensures their optimal function by regulating transcriptional activity of Bcl-6.

Keywords: Bcl6; Immune response; Immunity; Immunology and Microbiology Section; T-cells; arthritis; autoimmunity; survivin.


Conflict of interest statement

CONFLICTS OF INTEREST

The authors declare no conflict of interest.

Figures

Figure 1
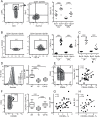
Figure 1. Survivin expression is an essential feature of human CXCR5+ Tfh cell phenotype
Intracellular expression of survivin was investigated in memory (CD45RA) or naïve (CD45RA+) CD4+ T cells of RA patients (n = 21) and healthy controls (n = 10) using flow cytometry. Cells are gated on CD4+ lymphocytes. Box plots show the frequency of survivin+ cells A. and the mean fluorescence intensity (MFI) of survivin B. Expression of CXCR5 C. within survivin+ and survivin CD4+ cells, and Bcl-6 D. within survivin+ and survivin memory (CD45RA) CD4+ cells of RA patients. The intensity of survivin expression E. within Bcl-6+ and Bcl-6 survivin+ CXCR5+ CD4 cells. The Mann-Whitney U-test was used to compare differences between groups. PBMCs of healthy subjects (1 × 10⁶/ml, n = 6) were cultured with anti-CD3 (0.25 μg/ml) alone or in combination with IL-12 (20 ng/ml) or IL-21 (50 ng/ml). On day 5, the formation of Tfh cells was recognized by expression of CXCR5 and intracellular production of IL-21. Cells were gated on viable CD4+ lymphocytes. Intensity of CXCR5 expression on survivin+ CD4 cells is shown F. The frequency of CXCR5+ cells within survivin+ and survivin CD4 subsets stimulated with αCD3 + IL-12 G. Intracellular production of IL-21 within the CXCR5+survivin+ and CXCR5+survivin CD4 cells stimulated with αCD3 + IL-12 is shown by histogram H. Frequency of PD-1+ IL-21+ cells is shown by box plots I. The Wilcoxon matched-pairs signed rank test to compare differences. Boxes and lines represent IQR and median, respectively, and error lines indicate min and max values.
Figure 2
Figure 2. Survivin and Bcl-6 co-localize and interact in human PBMC
Freshly isolated human PBMCs were stained with CXCR5, survivin and Bcl-6, and acquired on an imaging flow cytometer. Cells were gated on CXCR5+ lymphocytes. Localization of CXCR5 (green), survivin (yellow) and Bcl-6 (red) within the same cell could be observed. Co-localization of survivin and Bcl-6 is recognized in the right-side column by yellow staining. Left column shows bright field (BF) analysis of the cells A. CD4 cells isolated from PBMC were stimulated with concanavalin A (5 μg/ml, 3 h) and stained for Bcl-6 (red) and survivin (green). Nuclear chromatin was stained with DAPI (purple). The nuclear localization of Bcl-6 and survivin is visualized within the cells B. DNA of human PBMC (n = 4), stimulated with LPS/concanavalin A, was immunoprecipitated (IP) with anti-survivin and anti-Bcl-6 antibodies and used in a ChIP assay. Normal IgG was used as a negative control. The IP DNA was then subjected to PCR using primer sets spanning the Bcl-6 response element (BRE) within the p53 promoter or the Blimp-1 gene, Prdm1 C. The input refers to PCR using 1% of total chromatin before IP. Quantification of ChIP analysis is presented as fold enrichment to the control IP D. A docking model of the putative survivin-Bcl-6 interaction is proposed and viewed perpendicular to E. and along F. the 2-fold axis of Bcl-6 BTB. The Cα ribbons of the survivin dimers are depicted in magenta (representing the 1st cluster) and orange (representing the 4th cluster), while the docking partners (Bcl-6 BTB subunits) are depicted in cyan and green, respectively.
Figure 3
Figure 3. Survivin positive subset of CD44hi CD4 lymphocytes in mouse possess a complete phenotype of Tfh cells
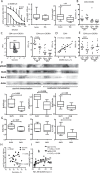
Spleen and lymph nodes from collagen II immunized arthritic (CIA) mice were analyzed for expression of survivin and Bcl-6 using flow cytometry A. Cells were gated on memory CD44hiCD4+ lymphocytes. Expression of CXCR5 B. and PD-1 C. was investigated within Bcl-6+ survivin+ and Bcl-6 survivin+ cells. Dots represent individual mice and the horizontal line shows median of the group. Survivin translation in CIA mice was inhibited by shRNA-producing constructs provided as a single intra-peritoneal injection (shSurv16, n = 10, or shSurv13+16, n = 10). Control mice were treated with a non-targeting RNA construct (shNT, n = 9). Survivin expression in spleen was analyzed by flow cytometry 12 days after the injection. Cells were gated on CD4+ lymphocytes. Intensity of survivin expression (MFI) within the groups is shown by a representative histogram and summarized in a box plot D. Survivin expression (MFI) on CD4 lymphocytes correlated to the size of CD44hiCD62L+ population E. Expression of CXCR5 on CD44hiCD4+ lymphocytes in the groups is shown as box plot F. CXCR5+ population correlates with the intensity of survivin G. and with Bcl-6 mRNA H. Boxes and lines represent IQR and median, respectively, and error lines indicate min and max values. The Mann-Whitney U-test was used to compare differences between groups. Correlation analyses were performed using Spearman's test.
Figure 4
Figure 4. Inhibition of survivin disturbs Bcl-6 dependent mechanisms of antibody production in experimental arthritis
Bcl-6 expression was analyzed in CIA mice treated with the survivin inhibiting (shSurv16 and shSurv13+16) and control (shNT) shRNA constructs, by immunohistological staining for Bcl-6 in spleen A. and by Western blot on bone marrow cells B. Bcl-6 was quantified in ratio to actin of each sample. Statistics for the groups is presented as box plots. Transcription of Bcl-6, IL-21, Nfat1 and Nfat2 in spleen was analyzed by RT-PCR and presented in relative quantity (RQ) to the median of the control group C. Spearman's rank correlation coefficient (rho) between the transcription of Bcl-6 vs. Blimp-1, Stat5b, Nfat1, IL-21, IRF4, and cMaf in spleen of CIA mice are shown D. Anti-collagen II (anti-CII) antibodies E. and anti-Fcgamma (anti-Fcg) antibodies F. in the serum of CIA mice treated with shSurv or shNT were measured by ELISA. Anti-CII antibodies correlated with survivin intensity in bone marrow and in spleen, measured by flow cytometry E. Anti-Fcg antibodies correlated with the intensity of survivin and with size of CXCR5+ CD4 population in spleen, measured by flow cytometry F. Boxes and lines represent IQR and median, respectively, and error lines indicate min and max values. The Mann-Whitney U-test was used to compare differences between groups. Correlation analyses were performed using Spearman's test.
Figure 5
Figure 5. Exposure to survivin enriched PD-1+ Bcl-6+ subset of Tfh cells via STAT3 dependent mechanisms
DBA/1 mice were immunized with survivin-derived peptide (100 μg/mouse × 4, subcutaneously). Control mice were immunized with ovalbumin-derived peptide (OVA). Both groups were then subjected to collagen-induced arthritis. Anti-survivin IgG antibodies, anti-Fcg antibodies, and survivin levels in serum were measured by ELISA A. Flow cytometry analysis of the expression of survivin B. in CD44hiCD4+ lymphocytes, and expression of PD-1 C. and Bcl-6 E. in survivin+CXCR5+ CD4+ lymphocytes in spleen (SPL) and lymph nodes (LN). PD-1 expression correlated to the size of CXCR5+survivin+ population D. Dots represent individual mice and the horizontal line shows median of the group. Protein levels of active STAT3 phosphorylated at Y705 (pStat3), total Stat3, Bcl-6 and actin in spleen were analyzed by the Western blot F. The levels of each protein were quantified in ratio to actin of each sample. Quantification of the detected bands is presented as box plots. Transcription of Bcl-6, cMaf and IL-21 in the spleen was analyzed by RT-PCR and presented in relative quantity (RQ) to the median of the control group G. Anti-survivin antibodies in serum correlated with the size of survivin+ CD4 population in spleen of survivin-immunized mice H. Comparison of the correlations in the survivin- and OVA-immunized groups is done by the Fisher r-to-z transformation analysis. Anti-Fcg antibodies correlated with the intensity of PD-1 on the CXCR5+survivin+ CD4 lymphocytes I., as measured by flow cytometry. Box plots with line represent IQR of the group and median, respectively, and error lines indicate min and max values. The Mann-Whitney U-test was used to compare differences between groups. Correlation analyses were performed using Spearman's test.

Similar articles

Cited by

References

    1. Nutt SL, Tarlinton DM. Germinal center B and follicular helper T cells: siblings, cousins or just good friends? Nat Immunol. 2011;12:472–7. - PubMed
    1. Ma CS, Deenick EK. Human T follicular helper (Tfh) cells and disease. Immunol Cell Biol. 2014;92:64–71. - PubMed
    1. Tangye SG, Cook MC, Fulcher DA. Insights into the role of STAT3 in human lymphocyte differentiation as revealed by the hyper-IgE syndrome. J Immunol. 2009;182:21–8. - PubMed
    1. Crotty S. Follicular helper CD4 T cells (TFH) Annu Rev Immunol. 2011:29621–63. - PubMed
    1. Linterman MA, Beaton L, Yu D, Ramiscal RR, Srivastava M, Hogan JJ, Verma NK, Smyth MJ, Rigby RJ, Vinuesa CG. IL-21 acts directly on B cells to regulate Bcl-6 expression and germinal center responses. J Exp Med. 2010;207:353–63. - PMC - PubMed

Publication types

MeSH terms