. 2015 Oct;47(10):1168-78.
doi: 10.1038/ng.3398. Epub 2015 Sep 7.

Virtual microdissection identifies distinct tumor- and stroma-specific subtypes of pancreatic ductal adenocarcinoma

Affiliations

Virtual microdissection identifies distinct tumor- and stroma-specific subtypes of pancreatic ductal adenocarcinoma

Richard A Moffitt et al. Nat Genet. 2015 Oct.

Abstract

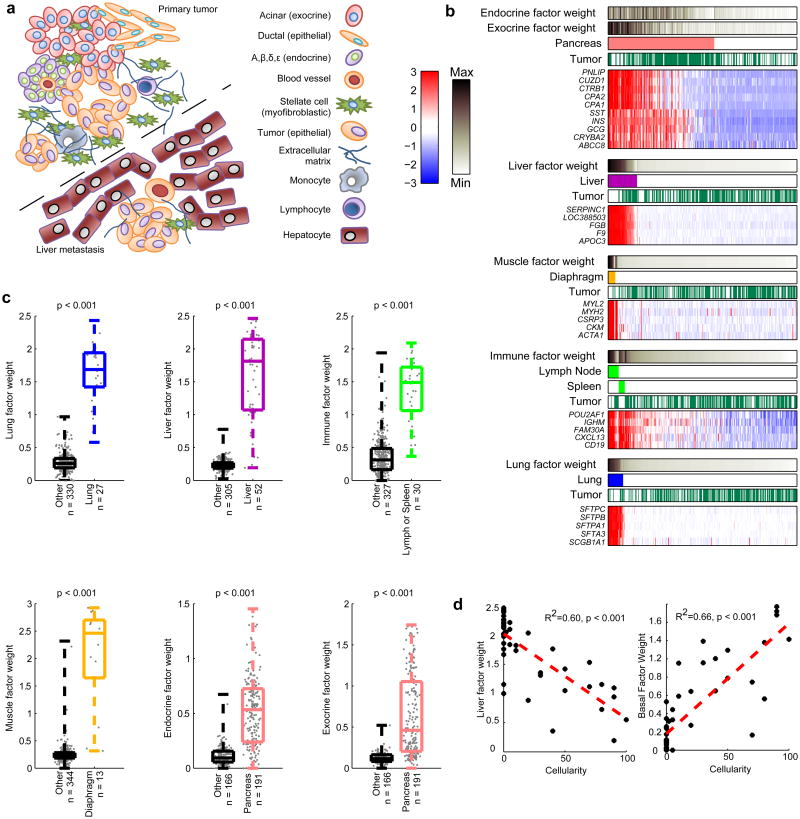
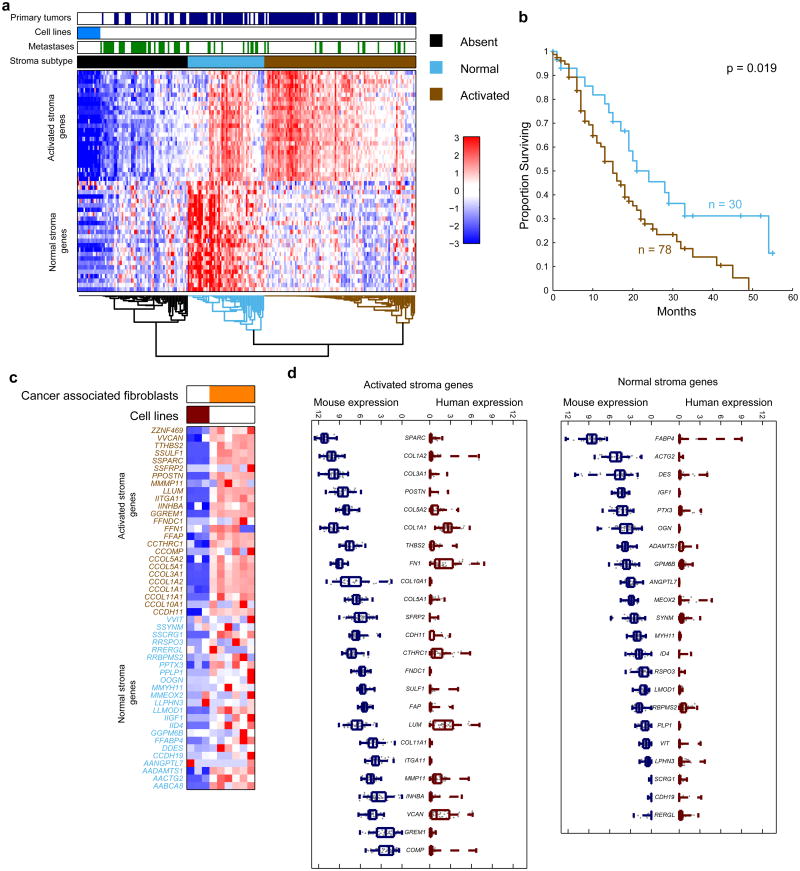
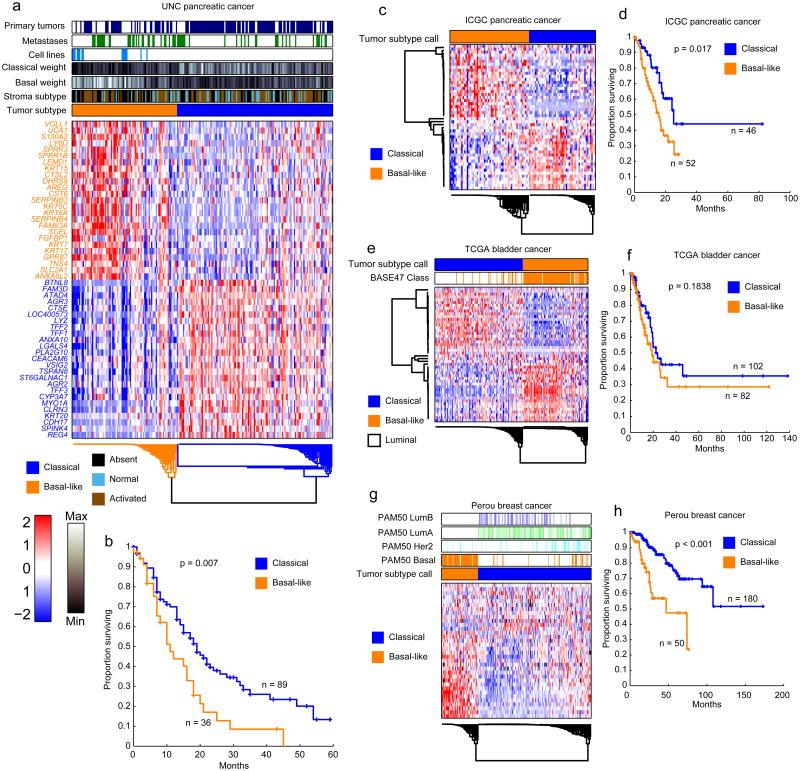
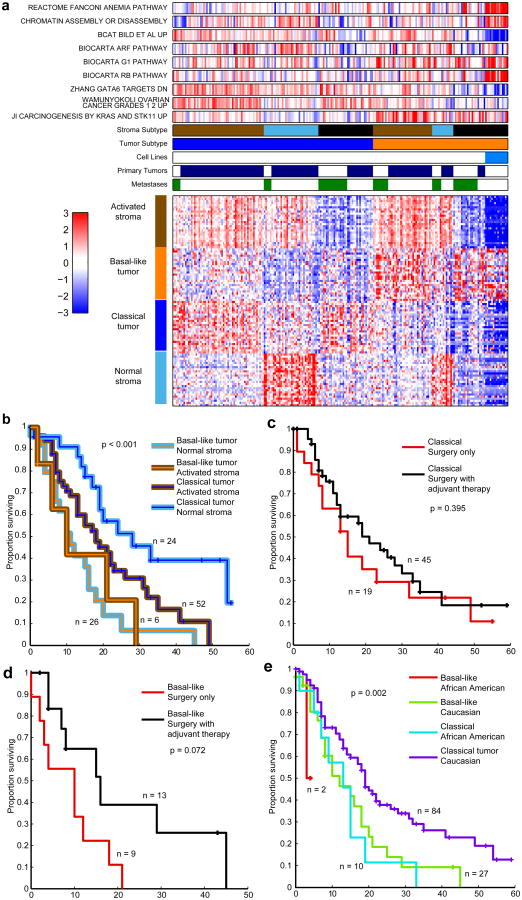
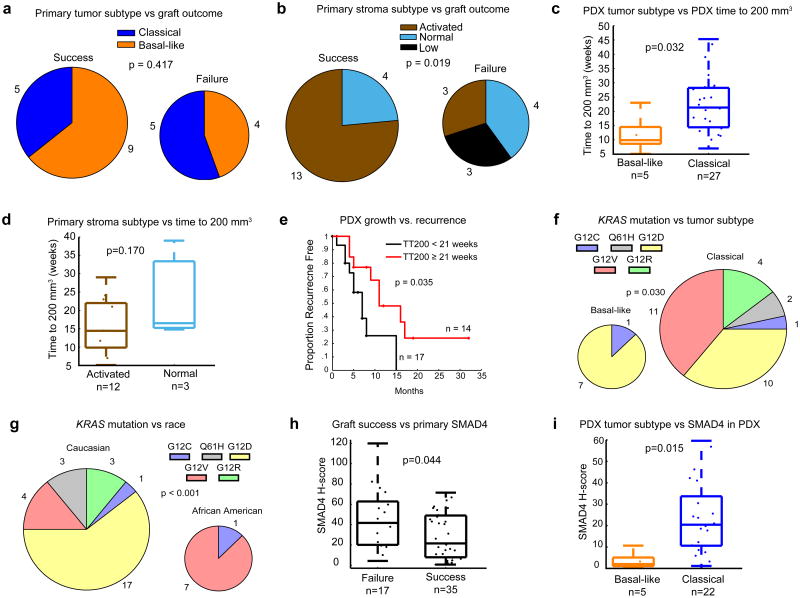
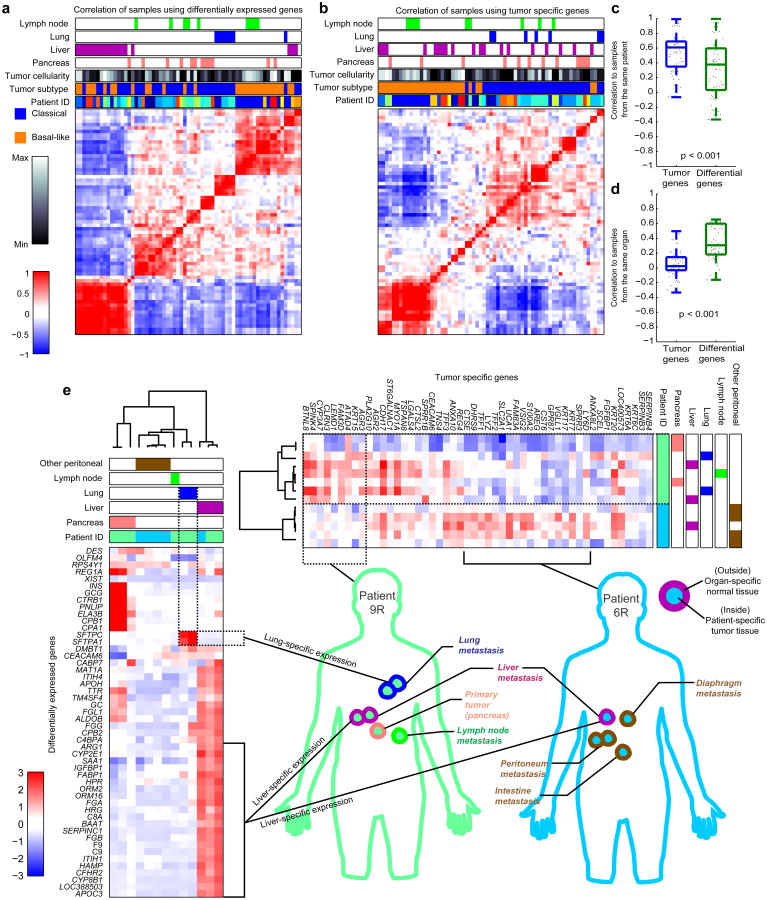
Pancreatic ductal adenocarcinoma (PDAC) remains a lethal disease with a 5-year survival rate of 4%. A key hallmark of PDAC is extensive stromal involvement, which makes capturing precise tumor-specific molecular information difficult. Here we have overcome this problem by applying blind source separation to a diverse collection of PDAC gene expression microarray data, including data from primary tumor, metastatic and normal samples. By digitally separating tumor, stromal and normal gene expression, we have identified and validated two tumor subtypes, including a 'basal-like' subtype that has worse outcome and is molecularly similar to basal tumors in bladder and breast cancers. Furthermore, we define 'normal' and 'activated' stromal subtypes, which are independently prognostic. Our results provide new insights into the molecular composition of PDAC, which may be used to tailor therapies or provide decision support in a clinical setting where the choice and timing of therapies are critical.


Figures

Figure 1
Figure 1
Successful Deconvolution of Normal Tissue with NMF. (a) Cartoon depicting the major cell types in primary tumor and liver metastasis samples. (b) (above) Overlap of sample types (solid colors) with factor weights (grayscale heat maps), and (below) heat maps of five exemplar genes for all tumors and adjacent normal tissues. Gene expression shown in the heat map has been Z-normalized. (c) Box and whiskers plots showing median, quartiles, and range comparing NMF factor weights across tissue types and corresponding t-test result. (d) Percent tumor cellularity versus NMF liver factor weight, and NMF basal tumor factor weight for metastases to the liver and adjacent liver samples. Linear regression lines are shown in red along with corresponding statistics.
Figure 2
Figure 2
Dual action of stroma is described by distinct gene expression patterns which are not expressed in cell lines. (a) Consensus clustered heat map of UNC primary tumor samples, metastases, and cell lines using genes from stromal factors. Samples clustered into 3 groups, describing samples with activated stroma, normal stroma, and samples with low or absent stromal gene expression. (b) Kaplan-Meier survival analysis of resected PDAC patients from the activated and normal stromal clusters shows that samples in the activated stroma group have worse prognosis, with a hazard ratio of 1.94 (CI = [1.11,3.37], p = 0.019). (c) Gene expression of stromal signatures are overexpressed in CAFs as compared to tumor cell lines. (d) Genes from both stromal signatures are specifically overexpressed by the mouse stroma in PDX tumors, and not expressed by the human tumor cells.
Figure 3
Figure 3
Tumor specific gene expression suggests two subtypes of PDAC with similarities to other tumor types. (a) Consensus clustered heat map of primary tumors, metastatic tumors, and cell line models of PDAC using correlation as the underlying distance function shows two subtypes of PDAC. (b) Kaplan-Meier survival analysis of resected primary patients from each tumor subtype (36 basal-like, 89 classical) in a shows differential prognosis among subtypes with a hazard ratio of 1.89, and a 95% CI of [1.19, 3.02]. (c) Consensus clustered heat map of tumors in the ICGC PDAC cohort split by basal and classical factor gene expression into basal-like (n=56) and classical (n=47) tumors. (d) Basal-like tumors in the ICGC data set has a hazard ratio of 2.11, with a 95% CI of [1.14, 3.89]. Median follow up was 20 months (e) Consensus clustered heat map of TCGA Bladder cancer samples split by basal and classical factor gene expression into basal-like (n=128) and classical-like (n=95) tumors strongly agrees with BASE47 basal calls shown above the heat map. (f) Subtyping in the TCGA BLCA data set had a hazard ratio of 1.43, with a 95% CI of [0.84, 2.42] (g) Consensus clustered heat map of the Perou breast cancer data set as split by basal factor genes (n=72 basal-like, n=223 not basal) strongly agrees with the division of samples into previously published basal and non-basal subtypes. (h) Basal-like breast cancer, as defined by our labeling, had a hazard ratio of 3.52, with a 95% CI of [1.94, 6.38].
Figure 4
Figure 4
Multivariate survival analysis of tumor and stromal subtypes. (a) Heat map of tumor samples using 25 genes from each of the tumor and stromal factors, with samples sorted horizontally by classification. Signature scores for selected gene sets appear above for each sample. (b) Combined Kaplan-Meier survival analysis of resected primary patients from basal-like or classical tumor types and normal or activated stroma subtypes with differential survival (p < 0.001 log-rank test). Differential prognosis among subtypes shows complementarity. Classical tumors with normal stroma subtypes (n=24) had the lowest hazard ratio of 0.39, and a 95% CI of [0.21, 0.73], while basal-like tumors with activated stroma subtypes (n=26) had the highest hazard ratio of 2.28 with a 95% CI of [1.34, 3.87]. (c) Kaplan-Meir survival analysis shows that patients with classical subtype tumors show less response to adjuvant therapy (HR = 0.76, 95% CI [0.40, 1.43]) compared to (d) basal-like tumors (HR of 0.38, and a 95% CI of [0.14, 1.09]). (e) Kaplan-Meir survival analysis shows that African-Americans have worse overall survival in both basal-like and classical subtypes, with a Hazard ratio of 2.28 and a 95% CI of [1.16,4.5].
Figure 5
Figure 5
Associations between tumor and stroma subtypes, PDX tumors, KRAS mutations and SMAD4 expression. (a) Tumor subtype was not associated with PDX graft success rate (p=0.417). (b) Activated stromal subtype samples engraft with higher success rates than low or normal stromal subtype samples (p=0.019) (c) Basal-like tumor subtype PDX reach 200 mm3 faster than classical subtype PDX (p=0.032). (d) PDX from samples with activated stroma subtype or normal stroma subtype do not have significantly different times to reach 200 mm3 (p=0.170). (e) PDX tumors with faster growth rates were associated with earlier recurrences in patients (HR = 0.31, 95% CI [0.10, 0.92]. (f) KRAS mutation type is not uniformly distributed among race or subtype. KRAS G12D mutations are more prevalent in basal-like subtype tumors than classical tumors (p=0.030). (g) African Americans have more G12V mutations, while Caucasians have more G12D mutations (p<0.001). (h) SMAD4 staining in primary tumors is predictive of successful PDX engraftment (p=0.044). (i) Basal-like subtype PDX exhibit weaker SMAD4 staining than classical subtype PDX (p=0.015).
Figure 6
Figure 6
Overcoming tumor cellularity reveals true heterogeneity among matched primary and metastatic sites. (a) Sample-sample correlations of matched primary and metastatic tumors using the 50 most differentially expressed genes across all samples (“DE50”) causes samples to group by organ location. (b) Sample-sample correlations using 25 genes each from classical and basal-like tumor lists (”T50”) caused samples to cluster instead by tumor subtype and patient of origin. (c) Correlation of samples within the same patient is higher when using T50 genes than when using DE50 genes. (d) Correlation of samples originating in the same organ was higher when using DE50 than when using T50. (e) Clustering of multiple samples from two patients using the DE50 divides samples by organ. Genes expressed highly in lung and liver tissue are noted with brackets. Clustering of the same samples using T50 genes separates samples by patient. Brackets note genes which differentiate the two patients. A diagram of sampled locations for these patients indicated by concentric circles, illustrating how samples simultaneously exhibit both patient (inner color) and organ (outer color) specific gene expression.

Comment in

Similar articles

Cited by

References

    1. Biankin AV, et al. Pancreatic cancer genomes reveal aberrations in axon guidance pathway genes. Nature. 2012;491:399–405. - PMC - PubMed
    1. Jones S, et al. Core Signaling Pathways in Human Pancreatic Cancers Revealed by Global Genomic Analyses. Science. 2008;321:1801–1806. - PMC - PubMed
    1. Waddell N, et al. Whole genomes redefine the mutational landscape of pancreatic cancer. Nature. 2015;518:495–501. - PMC - PubMed
    1. Yachida S, et al. Distant metastasis occurs late during the genetic evolution of pancreatic cancer. Nature. 2010;467:1114–1117. - PMC - PubMed
    1. Collisson EA, et al. Subtypes of pancreatic ductal adenocarcinoma and their differing responses to therapy. Nature medicine. 2011;17:500–503. - PMC - PubMed

Publication types

Associated data