. 2015 Oct;16(10):1025-33.
doi: 10.1038/ni.3267. Epub 2015 Sep 7.

Sequence-specific activation of the DNA sensor cGAS by Y-form DNA structures as found in primary HIV-1 cDNA

Affiliations

Sequence-specific activation of the DNA sensor cGAS by Y-form DNA structures as found in primary HIV-1 cDNA

Anna-Maria Herzner et al. Nat Immunol. 2015 Oct.

Abstract

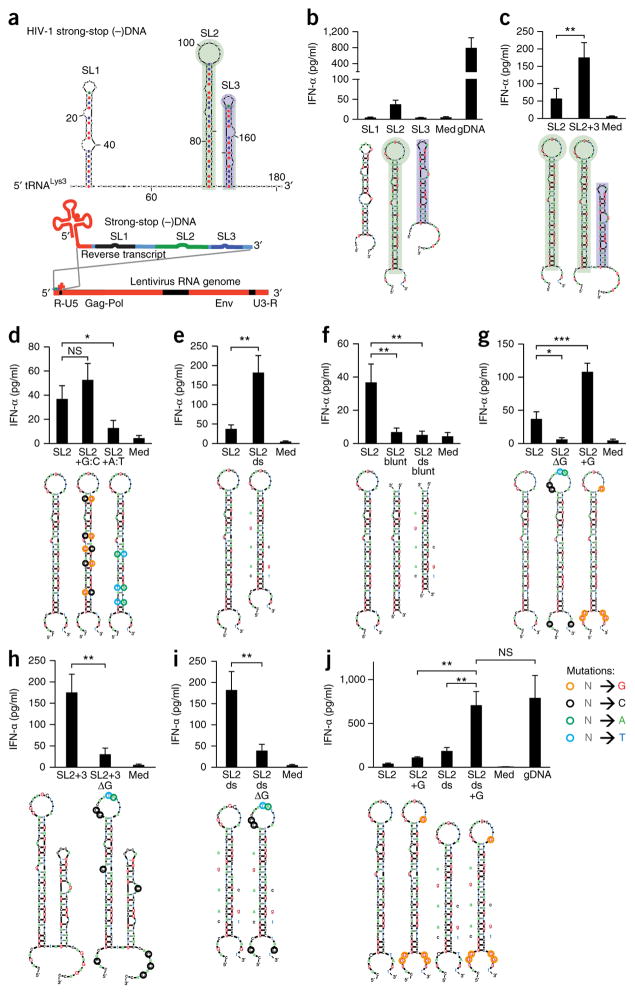
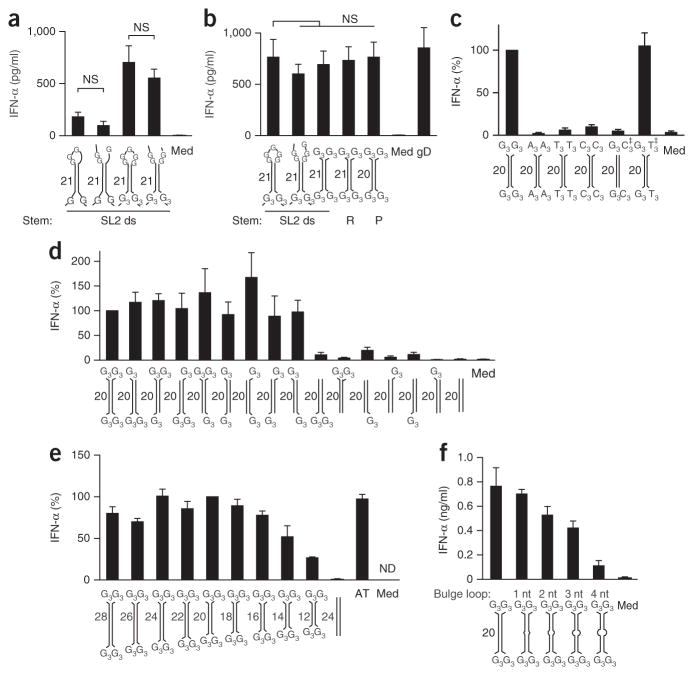
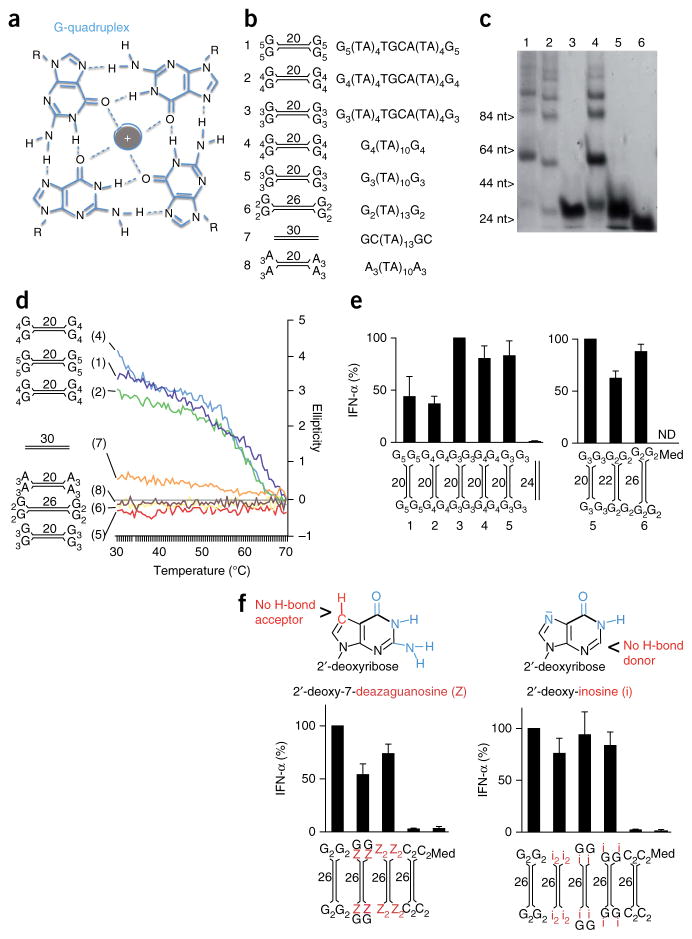
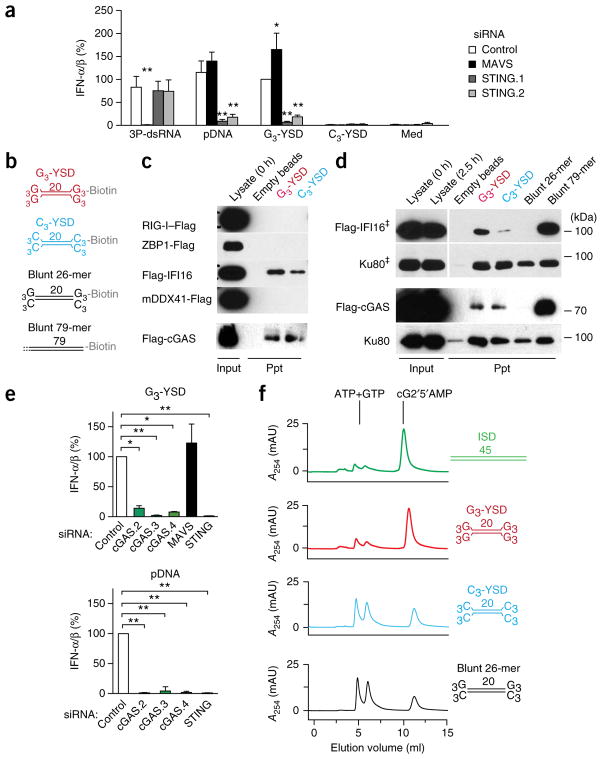
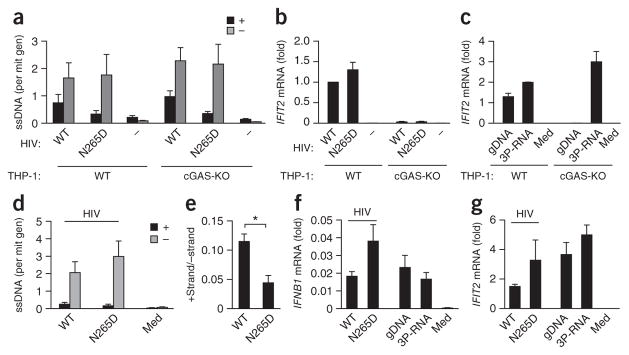
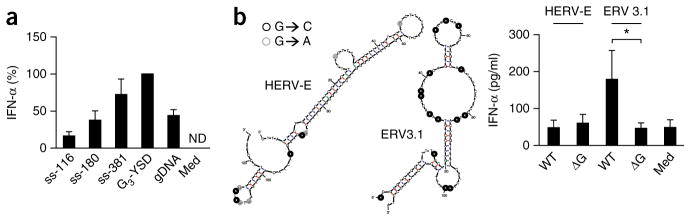
Cytosolic DNA that emerges during infection with a retrovirus or DNA virus triggers antiviral type I interferon responses. So far, only double-stranded DNA (dsDNA) over 40 base pairs (bp) in length has been considered immunostimulatory. Here we found that unpaired DNA nucleotides flanking short base-paired DNA stretches, as in stem-loop structures of single-stranded DNA (ssDNA) derived from human immunodeficiency virus type 1 (HIV-1), activated the type I interferon-inducing DNA sensor cGAS in a sequence-dependent manner. DNA structures containing unpaired guanosines flanking short (12- to 20-bp) dsDNA (Y-form DNA) were highly stimulatory and specifically enhanced the enzymatic activity of cGAS. Furthermore, we found that primary HIV-1 reverse transcripts represented the predominant viral cytosolic DNA species during early infection of macrophages and that these ssDNAs were highly immunostimulatory. Collectively, our study identifies unpaired guanosines in Y-form DNA as a highly active, minimal cGAS recognition motif that enables detection of HIV-1 ssDNA.


Conflict of interest statement

COMPETING FINANCIAL INTERESTS

The authors declare no competing financial interests.

Figures

Figure 1
Figure 1
Immunostimulation by stem-loop-forming structures in HIV-1 sstDNA depends on unpaired guanosines flanking the stem. (a) mFOLD model of HIV-1 sstDNA, the primary lysyl-tRNA (tRNALys3)-primed reverse transcript of the 5′ untranslated region (R-U5). Gag-Pol and Env, regions encoding HIV-1 group-associated antigen (Gag), polymerase (Pol) and envelope (Env) proteins; U3-R, 3′ untranslated region and repeat. (bj) Enzyme-linked immunosorbent assay (ELISA) of IFN-α in supernatants of chloroquine-treated human PBMCs 20 h after treatment with medium alone (Med) or transfection of genomic DNA (gDNA) or wild-type stem-loop structures SL1, SL2 or SL3 (b), or of wild-type SL2 (cj) or a combination of SL2 and SL3 (SL2+3) (c), SL2 with introduced C:G base pairs (SL2 +G:C) or A:T base pairs (SL2 +A:T) (d), SL2 with mismatches and bulges removed from the stem (SL2 ds) (e), SL2 (SL2 blunt) or the SL2 mutant in e (SL2 ds blunt) with single-stranded parts removed (f), SL2 with substitution of guanosines (SL2 ΔG) or conversion of various nucleotides (color loops) to guanosine (SL2+G) in the loop as well as the 3′ and 5′ ends (g), the combined SL2 plus SL3 in c with (SL2+3 ΔG) or without (SL2+3) substitution of unpaired guanosines (h), the SL2 mutant in e with (SL2 ds ΔG) or without (SL2 ds) substitution of unpaired guanosines (i), or SL2 with conversion of various nucleotides (color loops) to guanosine (SL2+G), removal of mismatches and bases (SL2 ds) or a combination of those changes (SL2 ds+G) (j). Below plots (bj), mFOLD models of secondary structures (sequences, Supplementary Table 1): colors indicate mutations (key; ‘N’ is any base.); letters adjacent to stems indicate bases removed. NS, not significant (P > 0.05); *P ≤ 0.05; **P ≤ 0.01 and ***P ≤ 0.001 (one-way analysis of variance (ANOVA) followed by Fisher’s least-significant difference LSD test.). Data are pooled from two (b,d,e,gj) or four (c,f) experiments with two biological replicates in each (mean and s.e.m. of n = 4 donors (b,d,e,gj; same experiments) or n = 8 donors (c,f; same experiments)).
Figure 2
Figure 2
Guanosine extensions render short DNA duplexes highly immunostimulatory. (a,b) ELISA of IFN-α in the supernatant of chloroquine-treated human PBMCs 20 h after treatment with medium alone or transfection of genomic DNA (as in Fig. 1) or the SL2 variant with mismatches and bulges removed from the stem (SL2 ds) and with a closed loop (first and third bars) or open loop (second and fourth bars) comprising the unmodified unpaired regions (first and second bars) or with conversion of various nucleotides to guanosine (as in Fig. 1j; third and fourth bars) (a) or with short duplexes comprising variants of single-stranded regions (first bar as in the third bar in a; second bar as in the fourth bar in a; third bar with G3 at each end) as well as different stem elements (third, fourth and fifth bars), randomized stem sequence (R) or palindromic stem sequence (P) (b). (c) ELISA of IFN-α in chloroquine-treated human PBMCs as in a,b, transfected with palindromic G3-YSD, A3-YSD, T3-YSD or C3-YSD, or with G3-YSD hybridized to C3-YSD or T3-YSD, the latter two at a twofold excess (‡); results are presented relative to those of cells transfected with G3-YSD, set as 100%. (d) ELISA of IFN-α in chloroquine-treated human PBMCs as in a,b, transfected with G3-YSD or YSD with various numbers and positions of unpaired G trimers flanking 20-nucleotide dsDNA (presented as in c). (e) ELISA of IFN-α in chloroquine-treated human PBMCs as in a,b, transfected with G3-YSD of various duplex lengths (12–28 bp) or with poly(dAdT) (AT); results are presented relative to those of cells transfected with G3-YSD with a 20-bp duplex, set as 100%. (f) ELISA of IFN-α in chloroquine-treated human PBMCs as in a,b, transfected with G3-YSD of various bulge-loop sizes in the base-paired region. Below plots, models of secondary structures (sequences, Supplementary Table 1); numbers adjacent to stems indicate stem length. ND, not detectable. NS, not significant (one-way-ANOVA followed by Fisher’s least-significant difference test). Data are pooled from two (ac,e,f) or three (d) experiments with one or two biological replicates in each (mean and s.e.m. of n = 4 donors (ac,f), n = 5 donors (d) or n = 3 donors (e)).
Figure 3
Figure 3
Induction of IFN-α/β by Y-form DNA is independent of the G quadruplex. (a) G-quadruplex assembly: four guanosines form a planar structure, mediated by hydrogen bonds and stabilized by a central cation (gray). R, deoxyribose backbone. (b) Structures and sequences of YSD or short blunt DNA used in ce. (c) Native PAGE of Gn-YSD variants (numbers above lanes correspond to models in b). (d) Circular-dichroism melting curve at 295 nm, with the ellipticity of YSD variants or blunt-end DNA (numbers in parentheses and diagrams at left match those in b) measured at 30–70 °C. (e) ELISA of IFN-α in supernatants of chloroquine-treated human PBMCs 20 h after transfection of Gn-YSD variants (numbers and diagrams below plots match those in b); results are presented relative to those of cells transfected with G3-YSD variant 3 (left) or variant 5 (right), set as 100%. (f) ELISA of IFN-α (bottom) as in e, after transfection of 26-nucleotide G2-YSD with stepwise substitution of terminal guanosines (G) with deazaguanosine (Z; left) or inosine (i; right); top, chemical structure of 2′-deoxy-7-deazaguanosine and 2′-deoxy-inosine. Numbers adjacent to stems (b,df) indicate stem length (sequences of DNA structures, Supplementary Table 1). Data are representative of two experiments (c,d) or are pooled from two (e, f, right) or three (f, right) experiments with one or two biological replicates in each (e,f; mean and s.e.m. of n = 3 donors (e), n = 6 donors (f, left) or n = 4 donors (f, right)).
Figure 4
Figure 4
G-YSD activates the cGAS-STING axis. (a) IFN-α/β activity in supernatants of THP-1 cells treated with control siRNA or siRNA targeting MAVS or STING (either of two target sequences (STING.1 or STING.2)) (key) and then, 72 h later, stimulated for 20 h with the RIG-I ligand 3P-dsRNA, plasmid DNA (pDNA), G3-YSD or C3-YSD; results are presented relative to those of THP-1 cells treated with control siRNA and stimulated with G3-YSD, set as 100%. (b) Secondary structures of biotinylated DNA duplexes used in interaction assays in c,d: G3-YSD or C3-YSD, or short, 26-nucleotide (26-mer) or long, 79-nucleotide (79-mer) blunt dsDNA. (c) Immunoblot analysis of Flag-tagged receptor candidates (left margin) with lysate alone (0.1 volume of the lysate used in the precipitation assays; Input) at the beginning (0 h) of the assay (far left lane) or after precipitation (Ppt) with empty beads (middle left lane) or with G3-YSD or C3-YSD (above lanes; as in b). (d) Immunoblot analysis of Flag-tagged IFI16 or cGAS or of the nonspecific DNA-binding control Ku80 with lysate alone (Input) at the beginning (0 h) or end (2.5 h) of the experiment, or after precipitation with empty beads, G3-YSD, C3-YSD (as in c), or with short (26-nucleotide) or long (79-nucleotide) blunt dsDNA (as in b) (above lanes). ‡, lysate and precipitate detection are from the same blot with one empty lane removed. (e) IFN-α/β in supernatants of THP-1 cells treated with control siRNA or siRNA targeting cGAS (one of three target sequences (cGAS.2, cGAS.3 or cGAS.4)), MAVS or STING (horizontal axes) and then, 48 h later, stimulated for 20 h with G3-YSD (top) or plasmid DNA (bottom); results are presented relative to those of THP-1 cells treated with control siRNA, set as 100%. (f) HPLC detecting the conversion of ATP and GTP to cG2′5′AMP (cyclic [G(2′,5′)pA(3′,5′)p]) by cGAS in the presence of ISD, G3-YSD, C3-YSD or the 26-nucleotide blunt DNA (without biotin) in b, presented (in milli-absorption units (mAU)) as absorption at 254 nm (A254). Sequences of DNA structures, Supplementary Table 1. *P ≤ 0.01 and **P ≤ 0.001, presented only for results significantly different from control (two-way ANOVA followed by Bonferroni’s post-hoc test (a) or one-way ANOVA followed by Tukey’s post-hoc test (e)). Data are pooled from three (a,e, bottom) or four (e, top) independent experiments with biological replicates (mean and s.e.m.) or are representative of three experiments (c,d,f).
Figure 5
Figure 5
The interferon response induced by HIV-1 infection correlates with the presence of (−)-strand DNA but not with the presence of (+)-strand DNA. (a) Strand-specific quantitative detection of the HIV-1 (+) strand and (−) strand (key) in cytosol-enriched nucleic acid preparations of wild-type (WT) or cGAS-deficient (cGAS-KO) THP-1 cells 4 h after infection with HIV-1 particles containing wild-type (HIV: WT) or mutant (HIV: N265D) reverse transcriptase or without infection (HIV: −); results are presented as ssDNA copies per mitochondrial genome (mit gen). (b,c) IFIT2 mRNA in THP-1 cells 4 h after treatment as in a (b) or after transfection of genomic DNA or 3P-dsRNA or treatment with medium alone (Med) (c); results are presented as copies of IFIT2 mRNA per copy of control GAPDH mRNA (c), or that value relative to the results of wild-type THP-1 cells infected with wild-type particles (b). (d) Strand-specific quantitative detection of the HIV-1 (+) and (−) strand (key) in cytosol-enriched nucleic acid preparations of monocyte-derived macrophages 4 h after no infection (Med) or infection with HIV-1 particles as in a (presented as in a). (e) Ratio of (+) strand to (−) strand in d. (f,g) IFNB1 mRNA (f) and IFIT2 mRNA (g) in monocyte-derived macrophages 4 h after stimulation with HIV-1 particles as in a or transfection of genomic DNA or 3P-dsRNA; results are presented as copies of IFNB1 mRNA (f) or IFIT2 mRNA (g) per copy of control GAPDH mRNA. *P ≤ 0.01 (ratio-paired t-test). Data are from three (a,b) i or two (c) independent experiments (mean and s.e.m.) or are pooled from two experiments with two biological replicates in each (dg; mean and s.e.m. of n = 4 donors).
Figure 6
Figure 6
Long ssDNA comprising the 5′-terminal HIV-1 (−)-strand sequence is highly immunostimulatory, and the recognition of endogenous retroelement-derived ssDNA depends on unpaired guanosines. (a) ELISA of IFN-α in supernatants of monocyte-derived macrophages 36 h after treatment with medium alone (Med) or transfection of genomic DNA, G3-YSD or ssDNA species of various lengths (116 nucleotides (ss-116; this is SL2 plus SL3 as in Fig. 1c), 180 nucleotides (ss-180) or 381 nucleotides (ss-381)); results are presented relative to those of cells transfected with G3-YSD, set as 100%. (b) IFN-α in supernatants of chloroquine-treated PBMCs 24 h after treatment with medium alone (Med) or transfection of wild-type (WT) or mutant (ΔG) HERV-E or ERV3.1 (right), and mFOLD-derived models of the secondary structures of HERV-E or ERV3.1 (left); circles indicate mutation of guanosine (black, G to C; gray: G to A). *P ≤ 0.05 (one-way ANOVA followed by Tukey’s post-hoc test). Data are pooled from two experiments with one or two biological replicates in each (mean and s.e.m. of n = 3 donors (a) or n = 4 donors (b)).

Comment in

References

    1. Krieg AM, et al. CpG motifs in bacterial DNA trigger direct B-cell activation. Nature. 1995;374:546–549. - PubMed
    1. Hemmi H, et al. A Toll-like receptor recognizes bacterial DNA. Nature. 2000;408:740–745. - PubMed
    1. Hartmann G, et al. Rational design of new CpG oligonucleotides that combine B cell activation with high IFN-alpha induction in plasmacytoid dendritic cells. Eur J Immunol. 2003;33:1633–1641. - PubMed
    1. Hornung V, et al. AIM2 recognizes cytosolic dsDNA and forms a caspase-1-activating inflammasome with ASC. Nature. 2009;458:514–518. - PMC - PubMed
    1. Fernandes-Alnemri T, Yu JW, Datta P, Wu J, Alnemri ES. AIM2 activates the inflammasome and cell death in response to cytoplasmic DNA. Nature. 2009;458:509–513. - PMC - PubMed

Publication types