. 2015 Sep 10;162(6):1309-21.
doi: 10.1016/j.cell.2015.08.027. Epub 2015 Sep 3.

Pathogen Cell-to-Cell Variability Drives Heterogeneity in Host Immune Responses

Affiliations

Pathogen Cell-to-Cell Variability Drives Heterogeneity in Host Immune Responses

Roi Avraham et al. Cell. .

Erratum in

  • Cell. 2015 Oct 8;163(2):523

Abstract

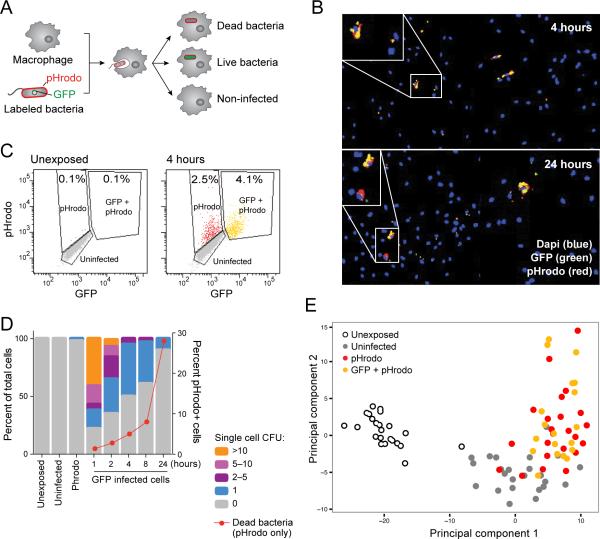
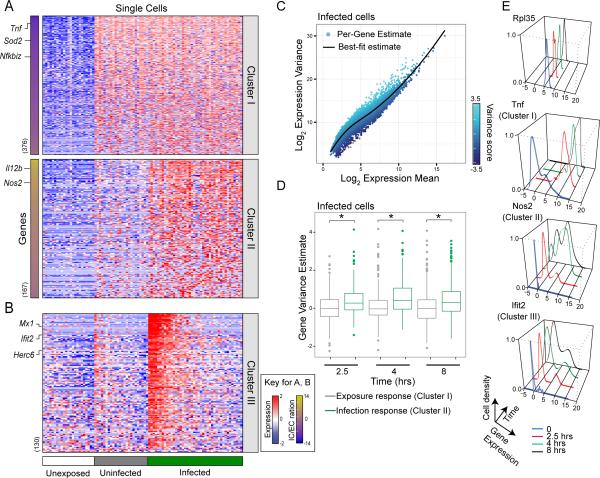
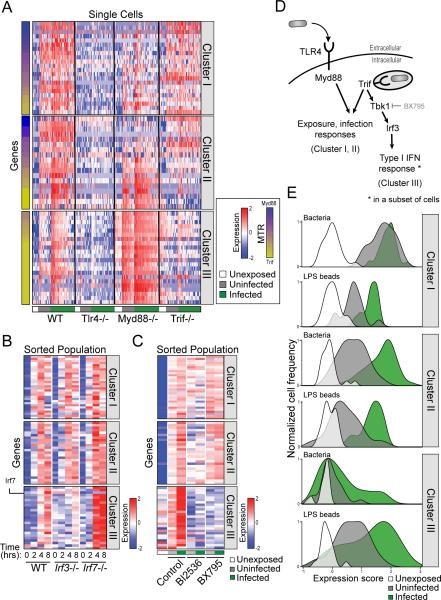
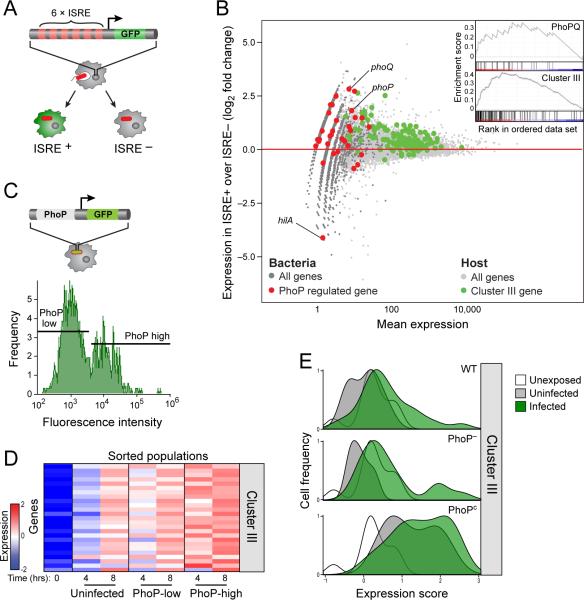
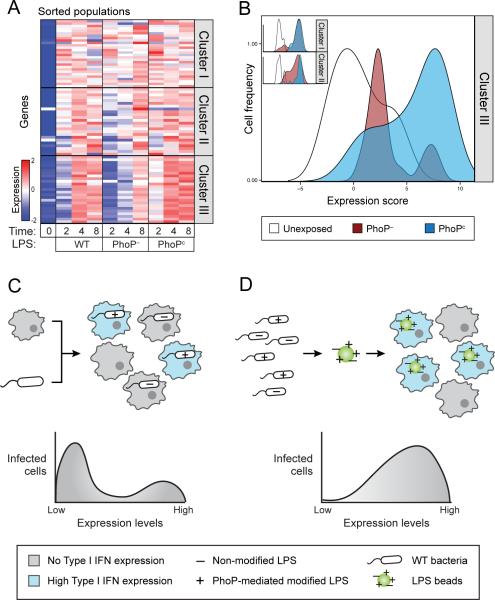
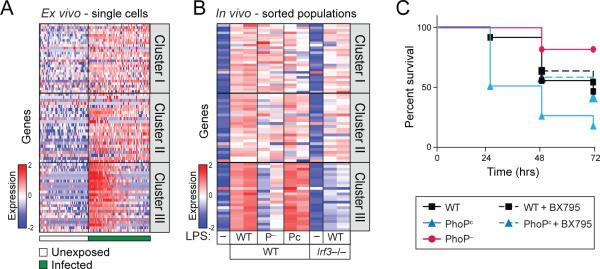
Encounters between immune cells and invading bacteria ultimately determine the course of infection. These interactions are usually measured in populations of cells, masking cell-to-cell variation that may be important for infection outcome. To characterize the gene expression variation that underlies distinct infection outcomes and monitor infection phenotypes, we developed an experimental system that combines single-cell RNA-seq with fluorescent markers. Probing the responses of individual macrophages to invading Salmonella, we find that variation between individual infected host cells is determined by the heterogeneous activity of bacterial factors in individual infecting bacteria. We illustrate how variable PhoPQ activity in the population of invading bacteria drives variable host type I IFN responses by modifying LPS in a subset of bacteria. This work demonstrates a causative link between host and bacterial variability, with cell-to-cell variation between different bacteria being sufficient to drive radically different host immune responses. This co-variation has implications for host-pathogen dynamics in vivo.


Figures

Figure 1
Figure 1. Heterogeneous outcomes of BMM-Salmonella encounters are captured by single-cell expression analysis
(A) Schematic representation of the experimental model, using BMMs infected with pHrodo-labeled, GFP-expressing S. typhimurium. (B) Representative images of mouse BMMs exposed to S. typhimurium reveals heterogeneity in infection phenotype including uninfected macrophages, and infected macrophages containing live (yellow) or dead (red) bacteria at early (4 hours; top) and late (24 hours; bottom) time points. (C) FACS analysis of fluorescently labeled populations (unexposed-left, exposed for 4 hours-right). (D) CFU enumerated from individual fluorescently labeled macrophages. Unexposed, uninfected and pHrodo+,GFP– cells had no or minimal surviving bacteria. GFP+ cells contain different numbers of cells over time (left y-axis). The red line indicates the percentage of pHrodo-only infected cells demonstrating the increase in the number of dead bacteria over time (right Y axis). (E) Single macrophages have distinct transcriptional responses depending on infection phenotype. 96 single cells from (C) were analyzed by RNA-seq and principle component analysis. Shown are the first two principal components (PC1 and PC2, 5 and 3 percent of the total variation respectively, Table S1B).
Figure 2
Figure 2. Single-cell expression profiling reveals macrophage subpopulations in infected cells
(A) Expression levels of genes (rows) in single BMMs (columns) were measured using single-cell RNA-seq after infection with S. typhimurium and grouped by their infection phenotype (unexposed (white, n=23), uninfected (grey, n=24), infected (green, n=42)). Genes are categorized into two cluseters as described. The number of genes in each cluster is denoted next to the heat map. Genes are arranged by the extracellular or intracellular ratio (IC/EC ratio, left bars indicate distribution of scores for each cluster, Table S2A). (B) Analysis of gene correlations across single cells revealed a cluster of bimodally expressed genes in infected cells (Cluster III). Cells in (A) and (B) are sorted according to average expression of Cluster III. (C) Highly variable genes in infected cells are enriched for immune response pathways (Table S2C). Localized regression was used to estimate the mean/variance relationship for genes in infected macrophages. Genes were assigned a variance score based on distance from the fitted relationship (solid line). (D) Shown are box plots of variance score for either exposure (Cluster I) or infection response genes (Cluster II), at three time points following infection. Infection response genes have reproducibly higher variance then exposure response genes (p<0.01 by Wilcoxon rank-sum test, Table S2D). (E) Representative examples of single-cell gene expression distributions in infected cells from Cluster I, II and III.
Figure 3
Figure 3. Analysis of macrophage pathways regulating the bimodal induction of the Type I IFN response
(A) Induction of Cluster III is solely dependent on Trif signaling. iBMMs from WT, Tlr4−/−, Myd88−/− or Trif−/− mice were infected with S. typhimurium and expression of single cells was analyzed. Genes are arranged by a score summarizing their Myd88 or Trif dependence (MTR, left bars indicate distribution of scores for each cluster, Table S3A). (B) BMMs from Irf3−/− and Irf7−/− mice were infected with pHrodo-stained GFP-labeled S. typhimurium. Decreased induction of representative genes from Cluster III was evident in Irf3−/− cells, compared to increased induction levels in Irf7−/− cells. (Table S3B) (C) BMMs were infected with pHrodo-labeled GFP-labeled S. typhimurium, in the presence of BI2536 and BX795. While BI2536 inhibited mostly Cluster III genes but also genes from Cluster I and II, BX795 specifically inhibits only the induction of only Cluster III genes. (Table S3C) (D) Schematic representation of the gene regulatory networks that control the response of macrophages to S. typhimurium infection. The induction of the Type I IFN response is due to activation of Tbk1 and Irf3 in only a subset of infected cells. (E) Plots summarize the expression of each gene cluster in BMMs infected with live bacteria (top panel) or with LPS coated beads (bottom panel) using a weighted average of scaled expression values (x-axis) verses the frequency of single cells (y-axis). In contrast to the bimodal activation of the Type I IFN response in cells infected with live bacteria, there was a much higher proportion of cells that activated Cluster III among the cells that had taken up LPS coated beads.
Figure 4
Figure 4. Heterogeneity of the invading bacterial populations shapes a heterogeneous host Type I IFN response
(A) Schematic of iBMMs with a transcriptional reporter (6XISRE-GFP) of the activity of the Type I IFN gene cluster. (B). Shown is an MA plot of the induction levels of host and bacterial transcripts in ISRE-positive over ISRE-negative cells (y-axis) versus average absolute read counts (x-axis). Infected ISRE- positive cells expressing high levels of Cluster III genes (green dots) are infected with bacteria expressing higher levels of PhoP regulated genes (red dots) compared with ISRE-negative cells. Inset indicates the enrichment of PhoPQ regulated genes and Cluster III (GSEA analysis, p=0.007 and p<0.001 respectively). (C) Schematic of S. typhimurium with the transcriptional reporter of PhoP activity (phoP-GFP, top). PhoP displayed bimodal activity in infected macrophages, as analyzed by FACS (bottom, infected cells were identified by pHrodo). (D) Cells infected with bacteria expressing high phoP-GFP show higher expression of Cluster III genes compared to cells infected with low phoP-GFP. (E) Plots summarize the expression of the Type I IFN response in BMMs infected with WT, PhoP, or PhoPc strains of S. typhimurium with a weighted average based score (x-axis) and display it versus the frequency of single cells (y-axis). Infection with PhoPc results in induction of the Type I IFN response in almost all infected cells, compared to cells infected with WT or PhoP strains. (Table S4)
Figure 5
Figure 5. Cell-to-cell variation in LPS modifications mediated by PhoPQ determines the bimodal induction of the Type I IFN response
(A) Cells stimulated with LPS from the PhoPc strain induce higher levels of Type I IFN responsive genes compared to cells stimulated with LPS from the WT strain. Cells stimulated with LPS from the PhoP strain showed less induction of this cluster. (Table S5A) (B) BMMs were stimulated with a mixture of red and green fluorescent beads coated with LPS extracted from PhoPc and PhoP respectively. Induction of the Type I IFN response is evident in a larger proportion of cells taking up beads coated with PhoPc LPS (blue) than in cells taking up beads coated with LPS from the PhoP strain (red). 74% of PhoPc compared to 26% of PhoP induce more than the highest unexposed cells (white), p=0.003 using a two-population proportion z-test. (Table S5B) (C+D) Schematic representation of the differences in the responses of BMMs to infection with live bacteria and to stimulation with LPS coated beads. Live bacteria are more heterogeneous than LPS coated beads.
Figure 6
Figure 6. LPS modifications mediated by PhoPQ impact in vivo infection outcomes
(A) Peritoneal macrophages, when infected ex vivo with GFP-labeled S. typhimurium show bimodal induction of Cluster III, like BMMs. (Table S6A) (B) Activation of the Type I IFN response in vivo was enhanced after stimulation with LPS extracted from PhoPc and reduced after stimulation with LPS extracted from PhoP strain, compared to LPS extracted from WT S. typhimurium. As a control, no induction of the Type I IFN response was measured in Irf3−/− mice. (Table S6B) (C) Mice challenged with LPS extracted from PhoPc (blue, n=12) showed reduced survival compared to mice challenged with WT LPS (black, n=11). Inhibition of the Type I IFN response by co-administration of BX795 improved survival from PhoPc challenge, restoring it to WT levels (dotted blue, n=12). Mice challenged with LPS extracted from PhoP (red, n=11) showed enhanced survival compared to WT.

Comment in

References

    1. Ackermann M, Stecher B, Freed NE, Songhet P, Hardt WD, Doebeli M. Self-destructive cooperation mediated by phenotypic noise. Nature. 2008;454:987–990. - PubMed
    1. Chevrier N, Mertins P, Artyomov MN, Shalek AK, Iannacone M, Ciaccio MF, Gat-Viks I, Tonti E, DeGrace MM, Clauser KR, et al. Systematic discovery of TLR signaling components delineates viral-sensing circuits. Cell. 2011;147:853–867. - PMC - PubMed
    1. Claudi B, Sprote P, Chirkova A, Personnic N, Zankl J, Schurmann N, Schmidt A, Bumann D. Phenotypic variation of Salmonella in host tissues delays eradication by antimicrobial chemotherapy. Cell. 2014;158:722–733. - PubMed
    1. Cummings LA, Wilkerson WD, Bergsbaken T, Cookson BT. In vivo, fliC expression by Salmonella enterica serovar Typhimurium is heterogeneous, regulated by ClpX, and anatomically restricted. Mol Microbiol. 2006;61:795–809. - PubMed
    1. Diard M, Garcia V, Maier L, Remus-Emsermann MN, Regoes RR, Ackermann M, Hardt WD. Stabilization of cooperative virulence by the expression of an avirulent phenotype. Nature. 2013;494:353–356. - PubMed

Publication types

Associated data