. 2015 Sep 10;162(6):1257-70.
doi: 10.1016/j.cell.2015.08.015. Epub 2015 Sep 3.

Cyclooxygenase-Dependent Tumor Growth through Evasion of Immunity

Affiliations

Cyclooxygenase-Dependent Tumor Growth through Evasion of Immunity

Santiago Zelenay et al. Cell. .

Abstract

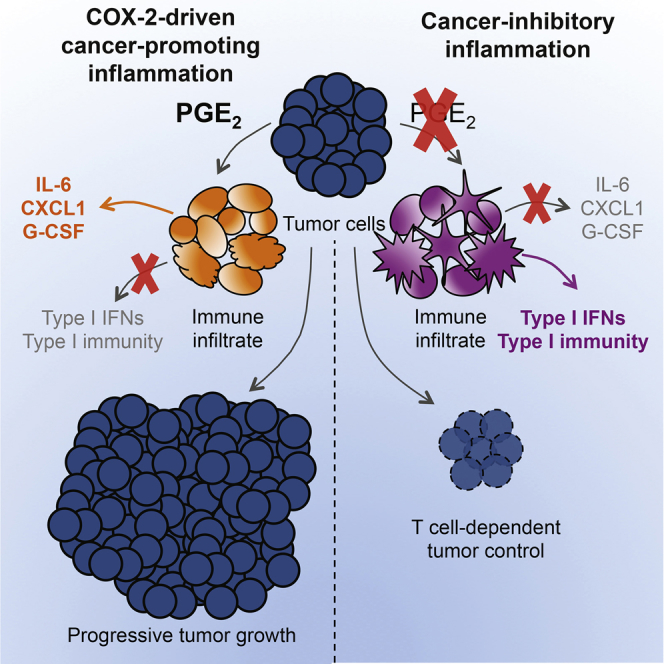
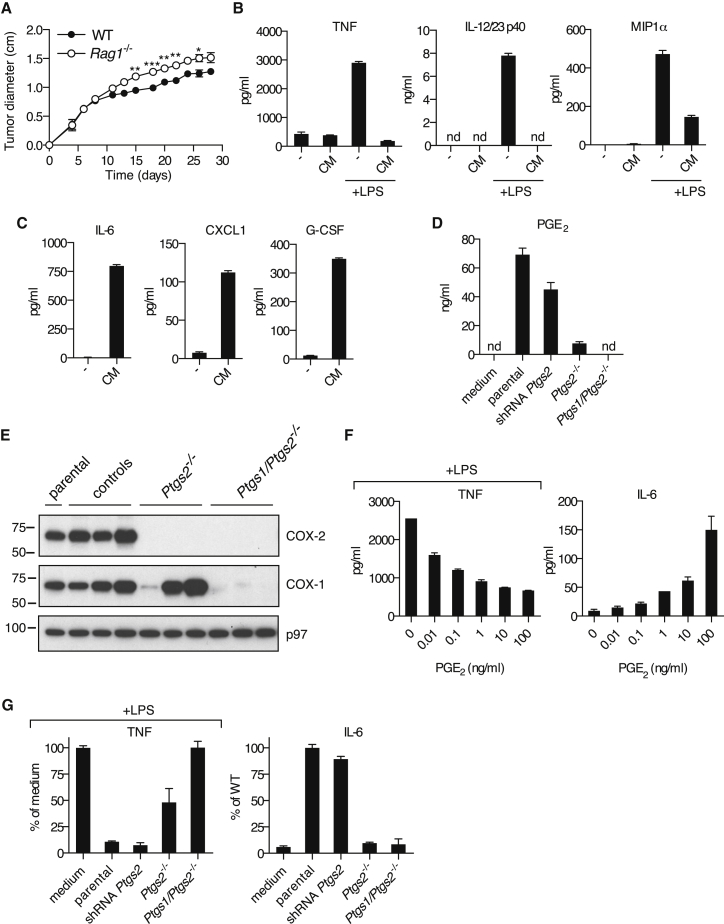
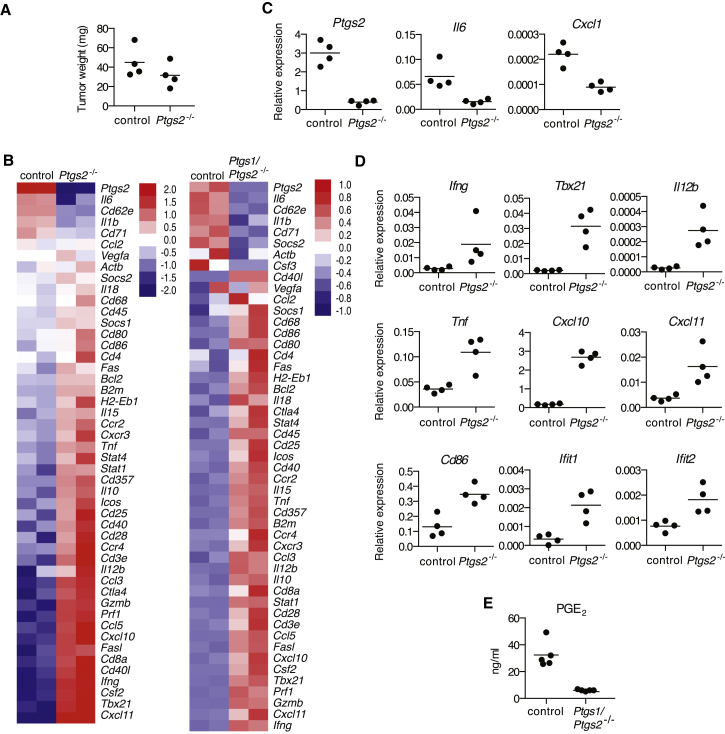
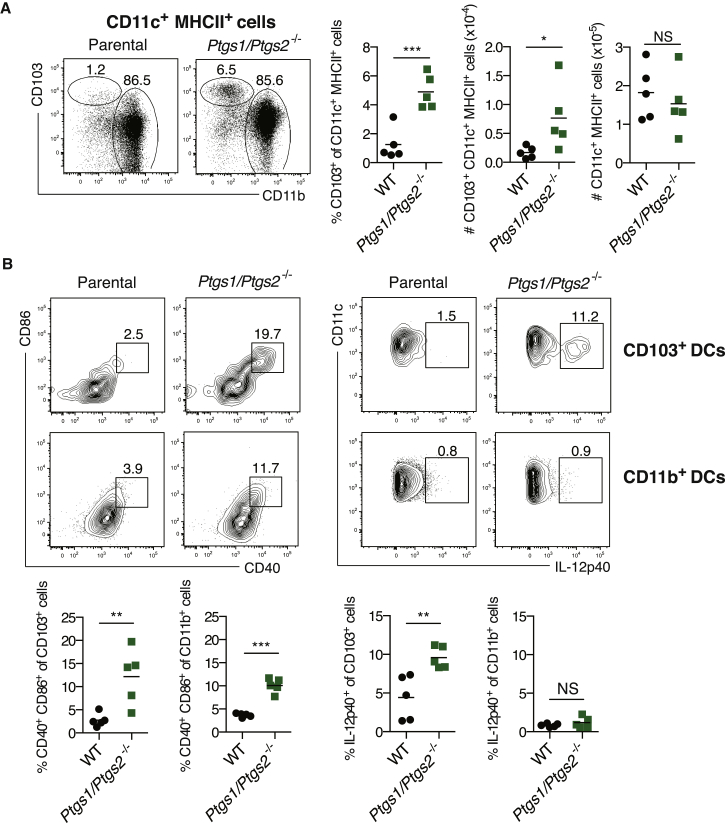
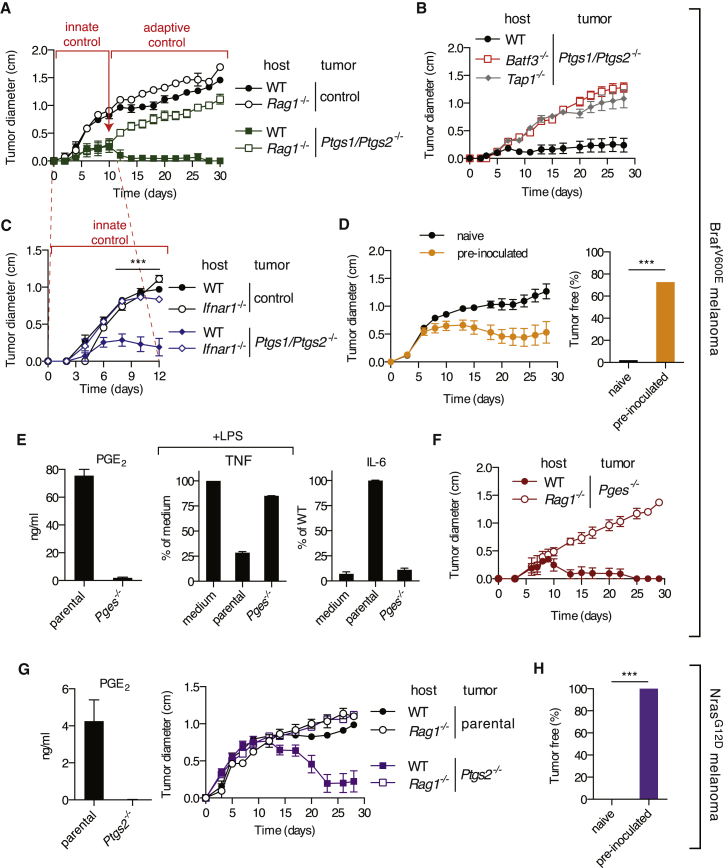
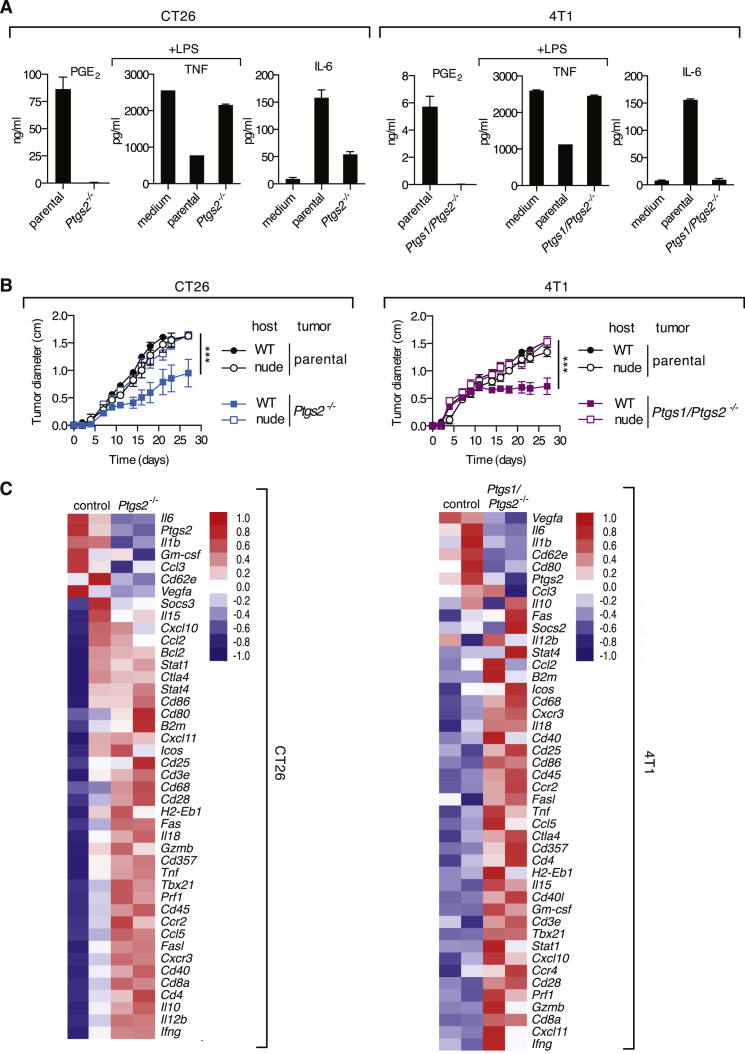
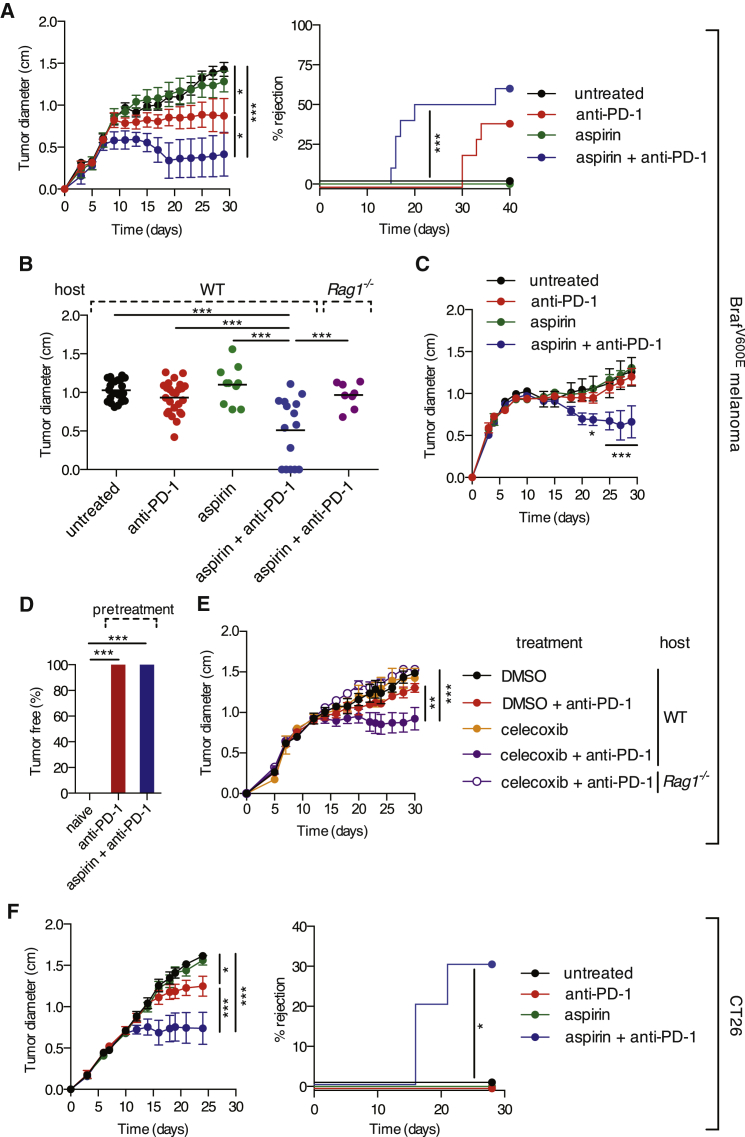
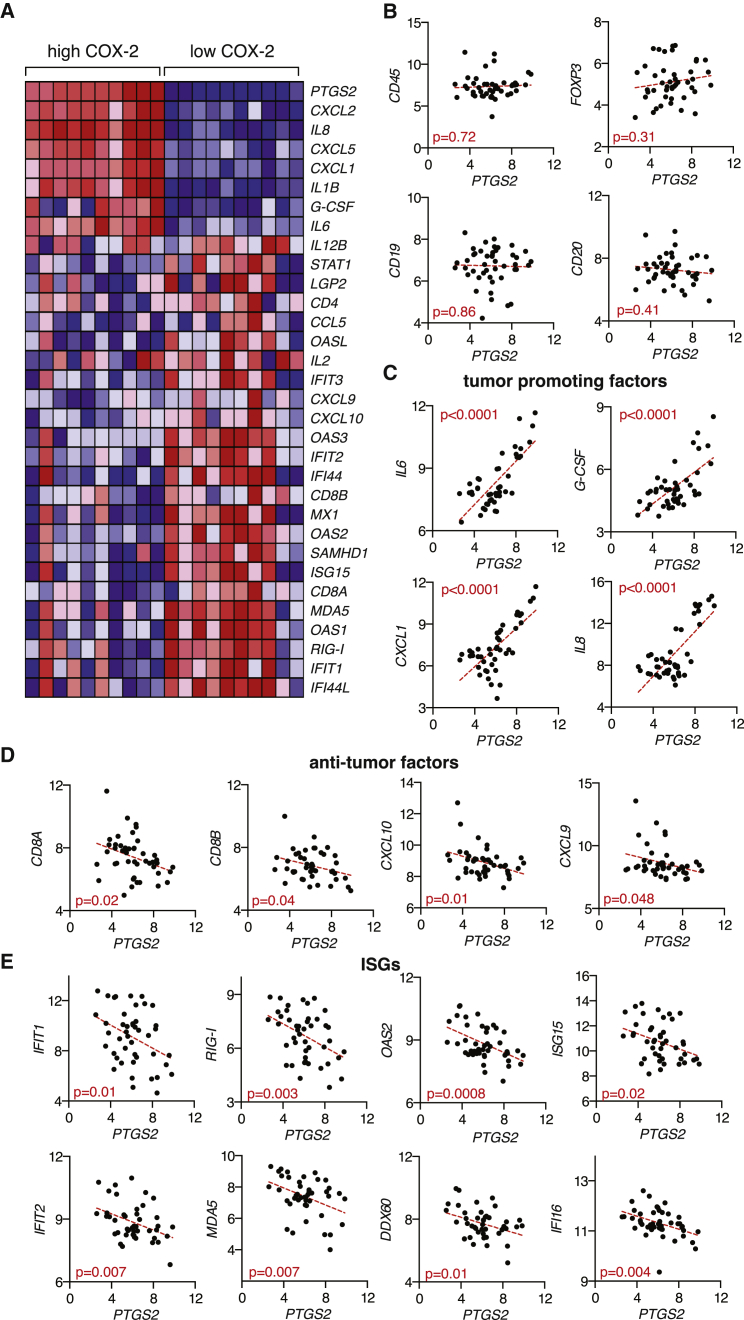
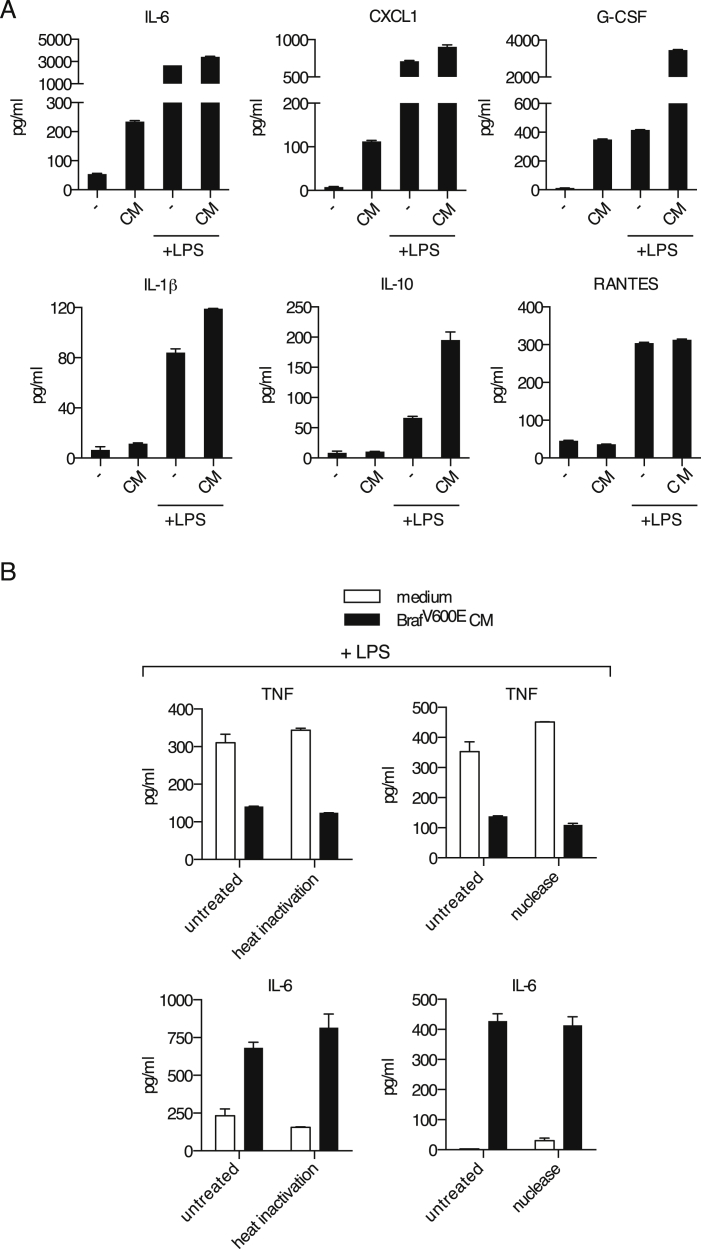
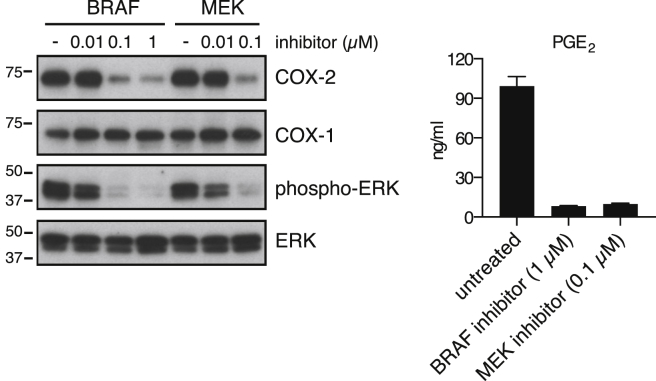
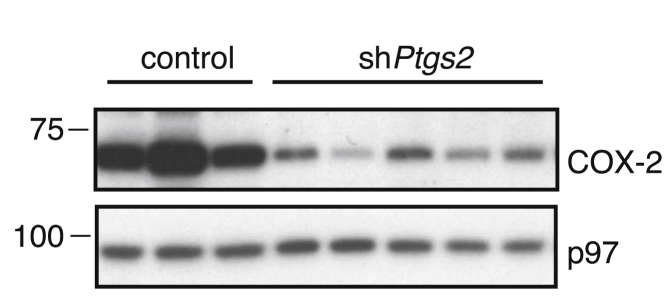
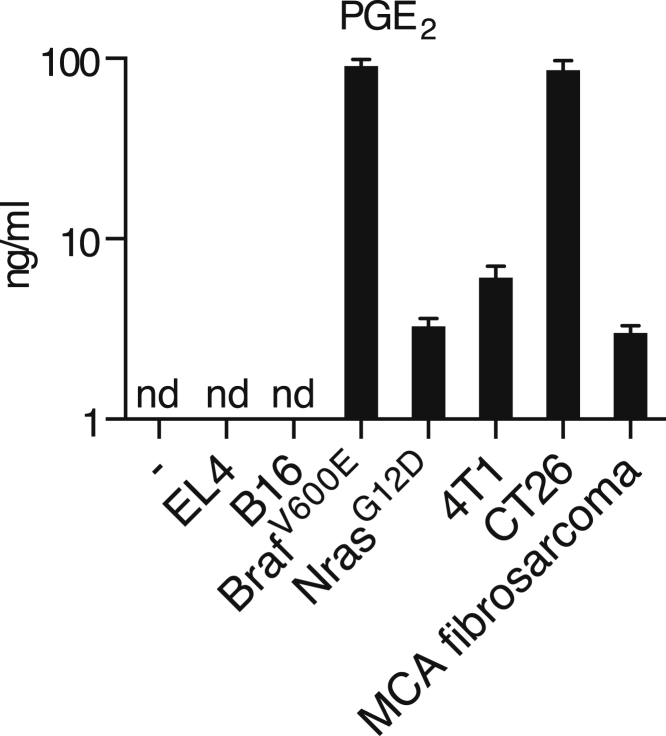
The mechanisms by which melanoma and other cancer cells evade anti-tumor immunity remain incompletely understood. Here, we show that the growth of tumors formed by mutant Braf(V600E) mouse melanoma cells in an immunocompetent host requires their production of prostaglandin E2, which suppresses immunity and fuels tumor-promoting inflammation. Genetic ablation of cyclooxygenases (COX) or prostaglandin E synthases in Braf(V600E) mouse melanoma cells, as well as in Nras(G12D) melanoma or in breast or colorectal cancer cells, renders them susceptible to immune control and provokes a shift in the tumor inflammatory profile toward classic anti-cancer immune pathways. This mouse COX-dependent inflammatory signature is remarkably conserved in human cutaneous melanoma biopsies, arguing for COX activity as a driver of immune suppression across species. Pre-clinical data demonstrate that inhibition of COX synergizes with anti-PD-1 blockade in inducing eradication of tumors, implying that COX inhibitors could be useful adjuvants for immune-based therapies in cancer patients.


Figures

None
Graphical abstract
Figure 1
Figure 1
COX-1- and COX-2-Dependent Tumor-Derived Prostanoids Modulate Myeloid Cells (A) Growth of BrafV600E cells following implantation into WT and Rag1−/− mice. Data are presented as average tumor diameters ± SEM and are representative of three independent experiments with three to five mice per group. Tumor growth profiles were compared using two-way ANOVA. p < 0.05, ∗∗p < 0.01, ∗∗∗p < 0.001. (B and C) BMMCs were cultured in the presence or absence of CM from BrafV600E cells with or without LPS (100 ng/ml). The concentration of TNF, IL-12/23 p40, and MIP1α (B) or IL-6, CXCL1, and G-CSF (C) in supernatants was determined after overnight culture. (D) BrafV600E cells unmodified (parental), control, stably expressing a Ptgs2-specific targeting shRNA construct, Ptgs2−/−, or Ptgs1/Ptgs2−/− were cultured to confluency, and the concentration of PGE2 in the supernatant was determined by ELISA. (E) Immunoblot of COX-2 and COX-1 in parental BrafV600E cells and three independent control, Ptgs2/, or Ptgs1/Ptgs2/ clones generated by CRISPR/Cas9-mediated genome engineering using distinct sets of sgRNAs targeting different regions of the Ptgs1 and Ptgs2 loci. p97 served as a loading control. (F) BMMCs were cultured in the presence of increasing amounts of synthetic PGE2 plus or minus LPS (100 ng/ml). The concentration of TNF (+LPS) and IL-6 (no LPS) in the supernatant was determined after overnight culture. (G) BMMCs were cultured as in (B) or (C) in presence of CM from the indicated BrafV600E melanoma cell lines. The concentration of TNF after overnight culture is expressed relative to the concentration of TNF in the supernatant of BMMCs cultured in presence of LPS without any CM (% of medium). The concentration of IL-6 is expressed relative to the concentration of IL-6 in the supernatant of BMMCs cultured with CM from parental BrafV600E cells (% of parental). nd, not detected. See also Figures S1, S2, S3, and S4.
Figure 2
Figure 2
Genetic Ablation of COX in BrafV600E Cells Shifts the Tumor Inflammatory Profile (A–E) WT mice were inoculated with 106 control, Ptgs2−/−, or Ptgs1/Ptgs2−/− BrafV600E cells. 4 days later, the expression of an array of immune-associated genes was determined by qPCR in whole-tumor homogenates. (A) Tumor weight at the time of harvest is shown. (B) Heatmaps for a selected list of genes show log2 ΔCT values normalized to hprt of two biological replicates for each value. The genes are ordered from highest to lowest by fold change in control relative to Ptgs2−/− or Ptgs1/Ptgs2−/− samples. (C and D) Relative expression of each gene normalized to hprt. (E) Concentration of PGE2 in lysates from 105 total tumor cells. Each dot represents one independent tumor. See also Figure S5.
Figure 3
Figure 3
Tumor-Derived Prostanoids Prevent CD103+ DC Accumulation and Activation (A and B) WT mice were inoculated with 106 parental or Ptgs1/Ptgs2−/− BrafV600E cells and tumor-infiltrating DCs were analyzed 4 days later. (A) Left: representative fluorescence-activated cell sorting (FACS) plots for CD103 versus CD11b within a CD11c+ MHCII+ DC gate. Right: percentage and number (#) of CD103+ CD11c+ MHCII+ or CD11c+ MHCII+ cells. (B) Upper: representative FACS plots for CD11c versus IL-12p40 or CD86 versus CD40 within a CD103+ or CD11b+ CD11c+ MHCII+ gate. Lower: percentage of IL-12p40+ or CD86+ CD40+ within CD103+ or CD11b+ CD11c+ MHCII+ cells. Each symbol in (A) and (B) represents an independent tumor. Samples were compared using two-tailed Student’s t test. p < 0.05, ∗∗p < 0.01, ∗∗∗p < 0.001.
Figure 4
Figure 4
Genetic Ablation of COX in BrafV600E or NrasG12D Melanoma Cells Enables Immune-Dependent Tumor Eradication (A–C) Growth of tumors formed following implantation of 105 control or Ptgs1/Ptgs2−/− BrafV600E cells into WT C57BL/6 (A–C), Rag1−/− (A), Batf3−/−, Tap1−/− (B), or Ifnar1−/− (C) mice. (D) Growth of parental BrafV600E cells following implantation into naive WT C57BL/6 mice or mice that previously rejected Ptgs1/Ptgs2−/− BrafV600E tumors (pre-inoculated). Data are compiled from three independent experiments and presented as tumor growth profile (left) and as percentage of tumor-free mice at 6 weeks post-parental tumor inoculation (right). (E) Concentration of PGE2 in CM from confluent parental or Pges−/− cell cultures cells or of TNF and IL-6 in the supernatant of an overnight culture of BMMCs cultured as in Figure 1 in presence of CM from the indicated cell line and expressed as in Figure 1G. (F) Growth profile of tumors formed following implantation of 105 parental or Pges/ BrafV600E cells into WT or Rag1−/− mice. (G) Concentration of PGE2 in CM from confluent cell cultures or growth profile of tumors formed following implantation of 105 parental or Ptgs2/ NrasG12D cells into WT or Rag1−/− mice (right). (H) The percentage of tumor-free mice at 6 weeks post-implantation of parental NrasG12D cells into naive WT C57BL/6 mice or mice that previously rejected Ptgs2−/− NrasG12D tumors (pre-inoculated). All growth profiles are presented as average tumor diameters ± SEM and are representative of at least two independent experiments with four to six mice per group. Tumor growth profiles were compared using two-way ANOVA and the percentage of tumor-free mice using Fisher’s exact test. ∗∗∗p < 0.001. See also Figure S6.
Figure 5
Figure 5
COX Ablation in Colorectal or Breast Cancer Cells Promotes Cancer-Inhibiting Inflammation and T-Cell-Dependent Tumor Growth Control (A) Concentration of PGE2 in CM from confluent parental and COX-deficient CT26 and 4T1 cell cultures cells and of TNF and IL-6 in the supernatant of an overnight culture of BMMCs cultured as in Figure 1 in presence of the indicated cell line CM. (B) Growth profile of tumors formed following implantation of 105 parental or Ptgs2−/− CT26 colorectal or of parental or Ptgs1/Ptgs2−/− 4T1 breast cancer cells into WT Balb/c or nude mice. Data are presented as average tumor diameters ± SEM and are representative of at least three independent experiments with four to six mice per group. Tumor growth profiles were compared using two-way ANOVA. ∗∗∗p < 0.001. (C) WT Balb/c mice were inoculated with 106 parental, Ptgs2−/− CT26 or Ptgs1/Ptgs2−/− 4T1 cells, and 4 days later the expression of an array of immune-associated genes was determined by qPCR in whole-tumor homogenates. Heatmaps for a selected list of genes show log2 ΔCT values normalized to hprt of two biological replicates for each value. The genes are ordered from highest to lowest by fold change in parental relative to Ptgs2−/− or Ptgs1/Ptgs2−/− samples.
Figure 6
Figure 6
COX Inhibition Synergizes with Anti-PD-1 Blockade in Immune-Dependent Tumor Growth Control (A) Left: growth of parental COX-competent tumors following implantation of 105 BrafV600E melanoma cells into C57BL/6 mice. Mice received aspirin in the drinking water and/or 200 μg of anti-PD-1 monoclonal antibody i.p. every 3–4 days from day 3 to day 24. Right: the percentage of mice that fully rejected tumors over time is shown. (B) Pooled tumor diameters at 19 days post-implantation of BrafV600E melanoma cells into WT or Rag1/− mice treated as in (A). Each dot represents one independent tumor. (C) As in (A) but using an inoculum of 106 melanoma cells. (D) The percentage of tumor-free mice at 6 weeks post-implantation of parental BrafV600E cells into C57BL/6 mice that were untreated (n = 15) (naive) or that previously rejected BrafV600E cells following anti-PD-1 (n = 6) or aspirin + anti-PD-1 treatment (n = 8) (pre-treatment). (E) As in (A) but C57BL/6 mice received celecoxib i.p. daily from day 0. (F) As in (A) but Balb/c mice received 105 CT26 colorectal cells. Growth profiles are presented as average tumor diameters ± SEM and are representative of at least two independent experiments with five mice per group. Samples were compared using two-way ANOVA (A, C, E, and F), one-way ANOVA (B), Fisher’s exact test (D), and log rank test (A and F). p < 0.05, ∗∗p < 0.01, ∗∗∗p < 0.001.
Figure 7
Figure 7
COX-2 Levels in Human Melanoma Biopsies Correlate Positively with Tumor-Promoting Factors and Negatively with Factors Associated with CTL Infiltration and Type I IFN Signaling (A–E) Microarray expression data (Talantov et al., 2005) from human cutaneous melanoma biopsies containing tumor cells, stroma, and infiltrate were analyzed for the association of PTGS2 expression with that of several immune-related genes. (A) Heatmap for a selected list of genes showing log2 expression signal for 20% of samples with highest (high COX-2) and lowest (low COX-2) PTGS2 expression. Genes were clustered using a Euclidean distance matrix and average linkage clustering. Red indicates higher expression, and blue indicates low expression relative to the mean expression of the gene across all samples. (B) Correlation data for PTGS2 versus CD45 (PTPRC), FOXP3, CD19, and CD20 expression. (C) Correlation data for PTGS2 versus IL-6, G-CSF (CSF3), CXCL1, and IL-8 expression. (D) Correlation data for PTGS2 versus CD8A, CD8B, CXCL10, and CXCL9. (E) Correlation data for PTGS2 versus the following ISGs: IFIT1, IFIT2, RIG-I (DDX58), MDA5 (IFIH1), OAS2, DDX60, ISG15, and IFI16. In (B)–(E), all cutaneous melanoma samples (n = 45) from the dataset (Talantov et al., 2005) were included in the analysis, with each dot representing one sample. The statistical significance of the correlation was determined using the Pearson’s correlation coefficient. A linear regression-fitting curve is shown as a dotted red line.
Figure S1
Figure S1
The Immunomodulatory Factor Secreted by BrafV600E Cells Is Neither a Protein Nor a Nucleic Acid, Related to Figure 1 (A) BMMCs were cultured in presence or absence of 100 μl of CM from BrafV600E cells plus or minus LPS (100 ng/ml). The concentration of IL-6, CXCL1, G-CSF, IL-1β, IL-10 or RANTES in the supernatant was determined after overnight culture. (B) BMMCs were cultured in absence (medium) or presence (BrafV600E CM) of 100 μl of untreated, heat-inactivated (20 min at 95°C) or nuclease-treated CM from BrafV600E cells plus or minus LPS (100 ng/ml). The concentration of TNF (+LPS) and IL-6 (no LPS) in the supernatant was determined after overnight culture.
Figure S2
Figure S2
Braf or MEK Inhibition Reduces COX-2 Expression and PGE2 Production in BrafV600E Cells, Related to Figure 1 BrafV600E melanoma cells were cultured for 48 hr in presence of a Braf inhibitor (PLX4720) or a MEK inhibitor (PD184352) at the indicated concentrations. The expression of COX-2, COX-1, phospho-ERK and ERK was determined by immunoblotting, left panels. For determination of PGE2 in the supernatant (right panel), the medium was replaced at 24 hr.
Figure S3
Figure S3
COX-2 Expression following Ptgs2-Specific Targeting Using shRNA, Related to Figure 1 Immunoblot of COX-2 in BrafV600E melanoma cells stably expressing various control or COX-2 specific shRNA constructs. p97 served as a loading control.
Figure S4
Figure S4
PGE2 Production by Cancer Cell Lines, Related to Figure 1 EL4 thymoma, B16 melanoma, BrafV600E melanoma, NrasG12D melanoma, methylcholanthrene (MCA)-induced fibrosarcoma, 4T1 breast and CT26 colorectal cancer cell lines were cultured to confluency and the concentration of PGE2 in the supernatant was determined by ELISA. nd, not detected.
Figure S5
Figure S5
Expression of Markers Associated with M2 Polarization in Tumors Formed by Ptgs2−/− Cells, Related to Figure 2 WT mice were inoculated with control or Ptgs2−/− BrafV600E cells and four days later the expression of Inos, Arg1, E-cadherin and Gas3 mRNA was determined by qPCR in whole tumor homogenates. Relative expression of each gene was normalized to hprt. Each dot represents one independent tumor.
Figure S6
Figure S6
Immune-Dependent Control of Growth of Independent Ptgs1/Ptgs2−/− Clones, Related to Figure 4 (A) WT or Rag1−/− mice were inoculated with 105 control or two independent Ptgs1/Ptgs2−/− BrafV600E melanoma cell lines (sgRNAs2 and sgRNAs3) generated using two combinations of sgRNAs targeting Ptgs1 and Ptgs2 that are different from the combination used to generate the Ptgs1/Ptgs2−/− BrafV600E cells used in Figures 2, 3, 4, and 5 (sgRNAs 1). Tumor growth is presented as average tumor diameters ± SEM of three to five mice per group. (B) The proliferative capacity of the three Ptgs1/Ptgs2−/− BrafV600E melanoma cell lines used in this study (sgRNAs 1, sgRNAs 2 and sgRNAs 3) was compared to that of control COX-expressing BrafV600E cells. The metabolic activity of the cells 72 hr after culture of the indicated number of cells was determined using a non-radioactive cell proliferation assay.

Comment in

References

    1. Bald T., Landsberg J., Lopez-Ramos D., Renn M., Glodde N., Jansen P., Gaffal E., Steitz J., Tolba R., Kalinke U. Immune cell-poor melanomas benefit from PD-1 blockade after targeted type I IFN activation. Cancer Discov. 2014;4:674–687. - PubMed
    1. Balkwill F., Charles K.A., Mantovani A. Smoldering and polarized inflammation in the initiation and promotion of malignant disease. Cancer Cell. 2005;7:211–217. - PubMed
    1. Becker M.R., Siegelin M.D., Rompel R., Enk A.H., Gaiser T. COX-2 expression in malignant melanoma: a novel prognostic marker? Melanoma Res. 2009;19:8–16. - PubMed
    1. Broz M.L., Binnewies M., Boldajipour B., Nelson A.E., Pollack J.L., Erle D.J., Barczak A., Rosenblum M.D., Daud A., Barber D.L. Dissecting the tumor myeloid compartment reveals rare activating antigen-presenting cells critical for T cell immunity. Cancer Cell. 2014;26:638–652. - PMC - PubMed
    1. Castle J.C., Loewer M., Boegel S., de Graaf J., Bender C., Tadmor A.D., Boisguerin V., Bukur T., Sorn P., Paret C. Immunomic, genomic and transcriptomic characterization of CT26 colorectal carcinoma. BMC Genomics. 2014;15:190. - PMC - PubMed

Publication types

MeSH terms