

Autodisplay of Human Hyaluronidase Hyal-1 on Escherichia coli and Identification of Plant-Derived Enzyme Inhibitors
- PMID: 26343612
- PMCID: PMC6331893
- DOI: 10.3390/molecules200915449
Autodisplay of Human Hyaluronidase Hyal-1 on Escherichia coli and Identification of Plant-Derived Enzyme Inhibitors
Abstract
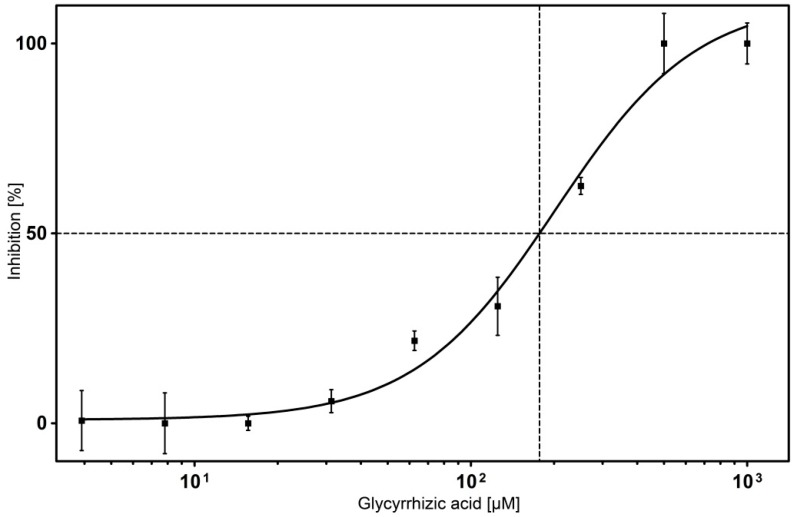
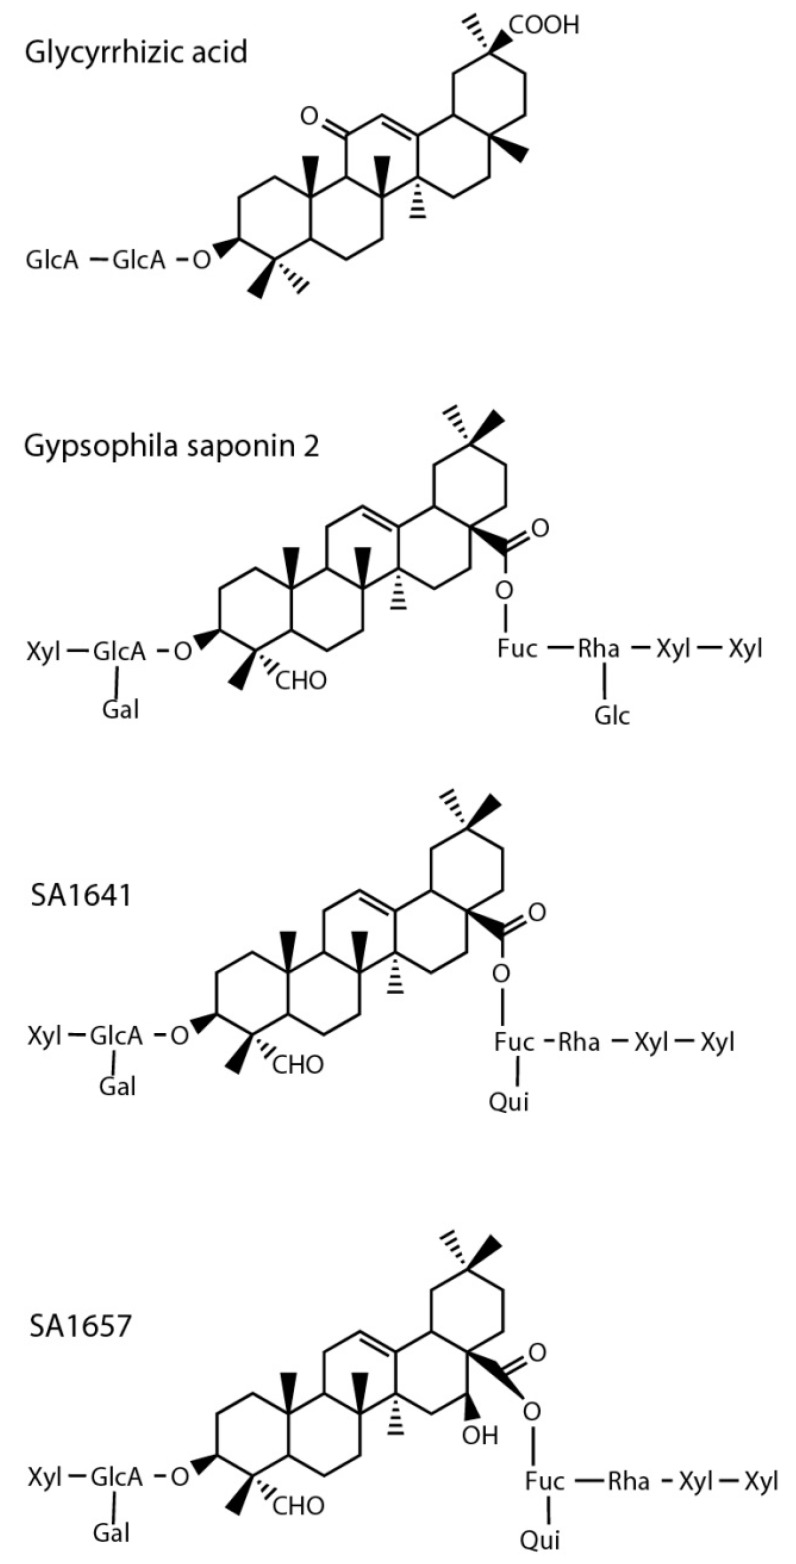
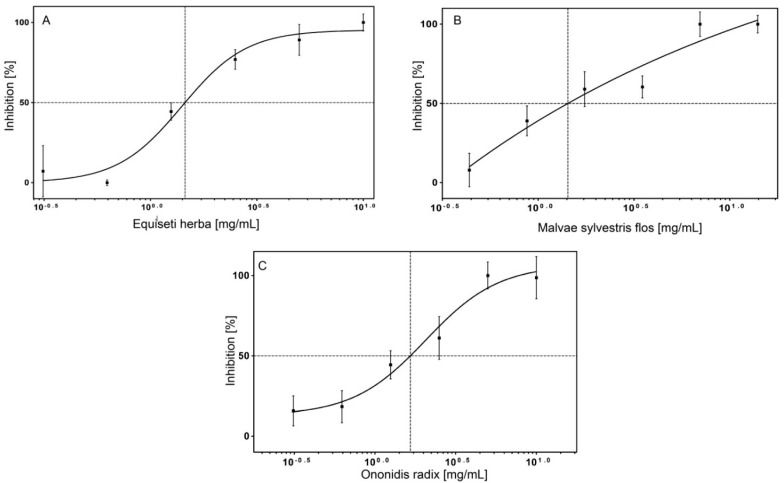
Hyaluronan (HA) is the main component of the extracellular matrix (ECM). Depending on its chain size, it is generally accepted to exert diverse effects. High molecular weight HA is anti-angiogenic, immunosuppressive and anti-inflammatory, while lower fragments are angiogenic and inflammatory. Human hyaluronidase Hyal-1 (Hyal-1) is one of the main enzymes in the metabolism of HA. This makes Hyal-1 an interesting target. Not only for functional and mechanistic studies, but also for drug development. In this work, Hyal-1 was expressed on the surface of E. coli, by applying Autodisplay, to overcome formation of inactive "inclusion bodies". With the cells displaying Hyal-1 an activity assay was performed using "stains-all" dye. Subsequently, the inhibitory effects of four saponins and 14 plant extracts on the activity of surface displayed Hyal-1 were evaluated. The determined IC50 values were 177 µM for glycyrrhizic acid, 108 µM for gypsophila saponin 2, 371 µM for SA1657 and 296 µM for SA1641. Malvae sylvestris flos, Equiseti herba and Ononidis radix extracts showed IC50 values between 1.4 and 1.7 mg/mL. In summary, Autodisplay enabled the expression of functional human target protein Hyal-1 in E. coli and facilitated an accelerated testing of potential inhibitors.
Keywords: Autodisplay; Hyal-1; hyaluronan; natural inhibitors.
Conflict of interest statement
The authors declare no conflict of interest.
Figures
Similar articles
-
Recombinant human hyaluronidase Hyal-1: insect cells versus Escherichia coli as expression system and identification of low molecular weight inhibitors.Glycobiology. 2007 Apr;17(4):444-53. doi: 10.1093/glycob/cwm003. Epub 2007 Jan 16. Glycobiology. 2007. PMID: 17227790
-
Isoflavonoids with inhibiting effects on human hyaluronidase-1 and norneolignan clitorienolactone B from Ononis spinosa L. root extract.Fitoterapia. 2018 Oct;130:169-174. doi: 10.1016/j.fitote.2018.08.013. Epub 2018 Sep 1. Fitoterapia. 2018. PMID: 30176279
-
CD44-dependent intracellular and extracellular catabolism of hyaluronic acid by hyaluronidase-1 and -2.J Biol Chem. 2007 Feb 23;282(8):5597-607. doi: 10.1074/jbc.M608358200. Epub 2006 Dec 14. J Biol Chem. 2007. PMID: 17170110
-
Purification of hyaluronidase as an anticancer agent inhibiting CD44.Biomed Chromatogr. 2020 Jan;34(1):e4709. doi: 10.1002/bmc.4709. Epub 2019 Nov 19. Biomed Chromatogr. 2020. PMID: 31630417 Review.
-
Devising a pathway for hyaluronan catabolism: are we there yet?Glycobiology. 2003 Dec;13(12):105R-115R. doi: 10.1093/glycob/cwg112. Epub 2003 Sep 26. Glycobiology. 2003. PMID: 14514708 Review.
Cited by
-
Exploring opportunities for drug repurposing and precision medicine in cannabis use disorder using genetics.Addict Biol. 2023 Aug;28(8):e13313. doi: 10.1111/adb.13313. Addict Biol. 2023. PMID: 37500481 Free PMC article.
-
A Novel, Cell-Compatible Hyaluronidase Activity Assay Identifies Dextran Sulfates and Other Sulfated Polymeric Hydrocarbons as Potent Inhibitors for CEMIP.Cells. 2025 Jan 11;14(2):101. doi: 10.3390/cells14020101. Cells. 2025. PMID: 39851529 Free PMC article.
-
In silico approach to explore the disruption in the molecular mechanism of human hyaluronidase 1 by mutant E268K that directs Natowicz syndrome.Eur Biophys J. 2017 Mar;46(2):157-169. doi: 10.1007/s00249-016-1151-0. Epub 2016 Jul 16. Eur Biophys J. 2017. PMID: 27424109
-
Improved Surface Display of Human Hyal1 and Identification of Testosterone Propionate and Chicoric Acid as New Inhibitors.Pharmaceuticals (Basel). 2020 Mar 26;13(4):54. doi: 10.3390/ph13040054. Pharmaceuticals (Basel). 2020. PMID: 32224932 Free PMC article.
-
Hyaluronidase-Expressing Salmonella Effectively Targets Tumor-Associated Hyaluronic Acid in Pancreatic Ductal Adenocarcinoma.Mol Cancer Ther. 2020 Feb;19(2):706-716. doi: 10.1158/1535-7163.MCT-19-0556. Epub 2019 Nov 6. Mol Cancer Ther. 2020. PMID: 31694889 Free PMC article.
References
-
- Bourguignon L.Y., Singleton P.A., Diedrich F., Stern R., Gilad E. CD44 interaction with Na+-H+ exchanger (NHE1) creates acidic microenvironments leading to hyaluronidase-2 and cathepsin B activation and breast tumor cell invasion. J. Biol. Chem. 2004;279:26991–27007. doi: 10.1074/jbc.M311838200. - DOI - PubMed
MeSH terms
Substances
LinkOut - more resources
Full Text Sources
Other Literature Sources
