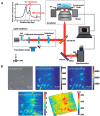
Label-Free Biosensor Imaging on Photonic Crystal Surfaces
- PMID: 26343684
- PMCID: PMC4610529
- DOI: 10.3390/s150921613
Label-Free Biosensor Imaging on Photonic Crystal Surfaces
Abstract
We review the development and application of nanostructured photonic crystal surfaces and a hyperspectral reflectance imaging detection instrument which, when used together, represent a new form of optical microscopy that enables label-free, quantitative, and kinetic monitoring of biomaterial interaction with substrate surfaces. Photonic Crystal Enhanced Microscopy (PCEM) has been used to detect broad classes of materials which include dielectric nanoparticles, metal plasmonic nanoparticles, biomolecular layers, and live cells. Because PCEM does not require cytotoxic stains or photobleachable fluorescent dyes, it is especially useful for monitoring the long-term interactions of cells with extracellular matrix surfaces. PCEM is only sensitive to the attachment of cell components within ~200 nm of the photonic crystal surface, which may correspond to the region of most interest for adhesion processes that involve stem cell differentiation, chemotaxis, and metastasis. PCEM has also demonstrated sufficient sensitivity for sensing nanoparticle contrast agents that are roughly the same size as protein molecules, which may enable applications in "digital" diagnostics with single molecule sensing resolution. We will review PCEM's development history, operating principles, nanostructure design, and imaging modalities that enable tracking of optical scatterers, emitters, absorbers, and centers of dielectric permittivity.
Keywords: biomaterial detection; label-free bioimaging; live cell imaging; nanoparticle detection; nanophotonics; photonic crystal; photonic crystal biosensor; photonic crystal enhanced fluorescence (PCEF); photonic crystal enhanced microscopy (PCEM); photonic crystal surface; protein-protein binding detection.
Figures


Similar articles
-
Quantitative Imaging of Cell Membrane-associated Effective Mass Density Using Photonic Crystal Enhanced Microscopy (PCEM).Prog Quantum Electron. 2016 Nov;50:1-18. doi: 10.1016/j.pquantelec.2016.10.001. Epub 2016 Nov 4. Prog Quantum Electron. 2016. PMID: 28649149 Free PMC article.
-
Label-free imaging of cell attachment with photonic crystal enhanced microscopy.Analyst. 2011 Sep 21;136(18):3608-15. doi: 10.1039/c1an15171a. Epub 2011 Jun 21. Analyst. 2011. PMID: 21691654
-
Photonic crystal enhanced microscopy for imaging of live cell adhesion.Analyst. 2013 Oct 21;138(20):5886-94. doi: 10.1039/c3an01541f. Epub 2013 Aug 22. Analyst. 2013. PMID: 23971078
-
Microscopies Enabled by Photonic Metamaterials.Sensors (Basel). 2022 Jan 30;22(3):1086. doi: 10.3390/s22031086. Sensors (Basel). 2022. PMID: 35161831 Free PMC article. Review.
-
Label-free cell-based assays using photonic crystal optical biosensors.Analyst. 2011 Mar 21;136(6):1090-102. doi: 10.1039/c0an00899k. Epub 2011 Jan 28. Analyst. 2011. PMID: 21279202 Review.
Cited by
-
A Nanofluidic Biosensor Based on Nanoreplica Molding Photonic Crystal.Nanoscale Res Lett. 2016 Dec;11(1):427. doi: 10.1186/s11671-016-1644-x. Epub 2016 Sep 23. Nanoscale Res Lett. 2016. PMID: 27664018 Free PMC article.
-
Fluorescent Aptamer Immobilization on Inverse Colloidal Crystals.Sensors (Basel). 2018 Dec 7;18(12):4326. doi: 10.3390/s18124326. Sensors (Basel). 2018. PMID: 30544583 Free PMC article.
-
Photonic Sensors in Chemical and Biological Applications.Biosensors (Basel). 2022 Nov 15;12(11):1021. doi: 10.3390/bios12111021. Biosensors (Basel). 2022. PMID: 36421139 Free PMC article.
-
Hyperchromatic structural color for perceptually enhanced sensing by the naked eye.Proc Natl Acad Sci U S A. 2020 Dec 1;117(48):30107-30117. doi: 10.1073/pnas.2009162117. Epub 2020 Nov 16. Proc Natl Acad Sci U S A. 2020. PMID: 33199646 Free PMC article.
-
Quantitative Imaging of Cell Membrane-associated Effective Mass Density Using Photonic Crystal Enhanced Microscopy (PCEM).Prog Quantum Electron. 2016 Nov;50:1-18. doi: 10.1016/j.pquantelec.2016.10.001. Epub 2016 Nov 4. Prog Quantum Electron. 2016. PMID: 28649149 Free PMC article.
References
-
- Hessel A., Oliner A.A. A new theory of wood’s anomalies on optical gratings. Appl. Opt. 1965;4:1275–1297. doi: 10.1364/AO.4.001275. - DOI
-
- Mashev L., Popov E. Diffraction efficiency anomalies of multicoated dielectric gratings. Opt. Commun. 1984;51:131–136. doi: 10.1016/0030-4018(84)90220-7. - DOI
-
- Popov E., Mashev L., Maystre D. Theoretical study of the anomalies of coated dielectric gratings. Opt. Acta. 1986;33:607–619. doi: 10.1080/713821994. - DOI
Publication types
MeSH terms
Substances
Grants and funding
LinkOut - more resources
Full Text Sources
Other Literature Sources

