

Effects of empagliflozin on blood pressure and markers of arterial stiffness and vascular resistance in patients with type 2 diabetes
- PMID: 26343814
- PMCID: PMC5057299
- DOI: 10.1111/dom.12572
Effects of empagliflozin on blood pressure and markers of arterial stiffness and vascular resistance in patients with type 2 diabetes
Abstract
Aims: To determine the effects of empagliflozin on blood pressure (BP) and markers of arterial stiffness and vascular resistance in patients with type 2 diabetes mellitus (T2DM).
Methods: We conducted a post hoc analysis of data from a phase III trial in patients with T2DM and hypertension receiving 12 weeks' empagliflozin and four phase III trials in patients with T2DM receiving 24 weeks' empagliflozin (cohort 1, n = 823; cohort 2, n = 2477). BP was measured using 24-h BP monitoring (cohort 1) or seated office measurements (cohort 2).
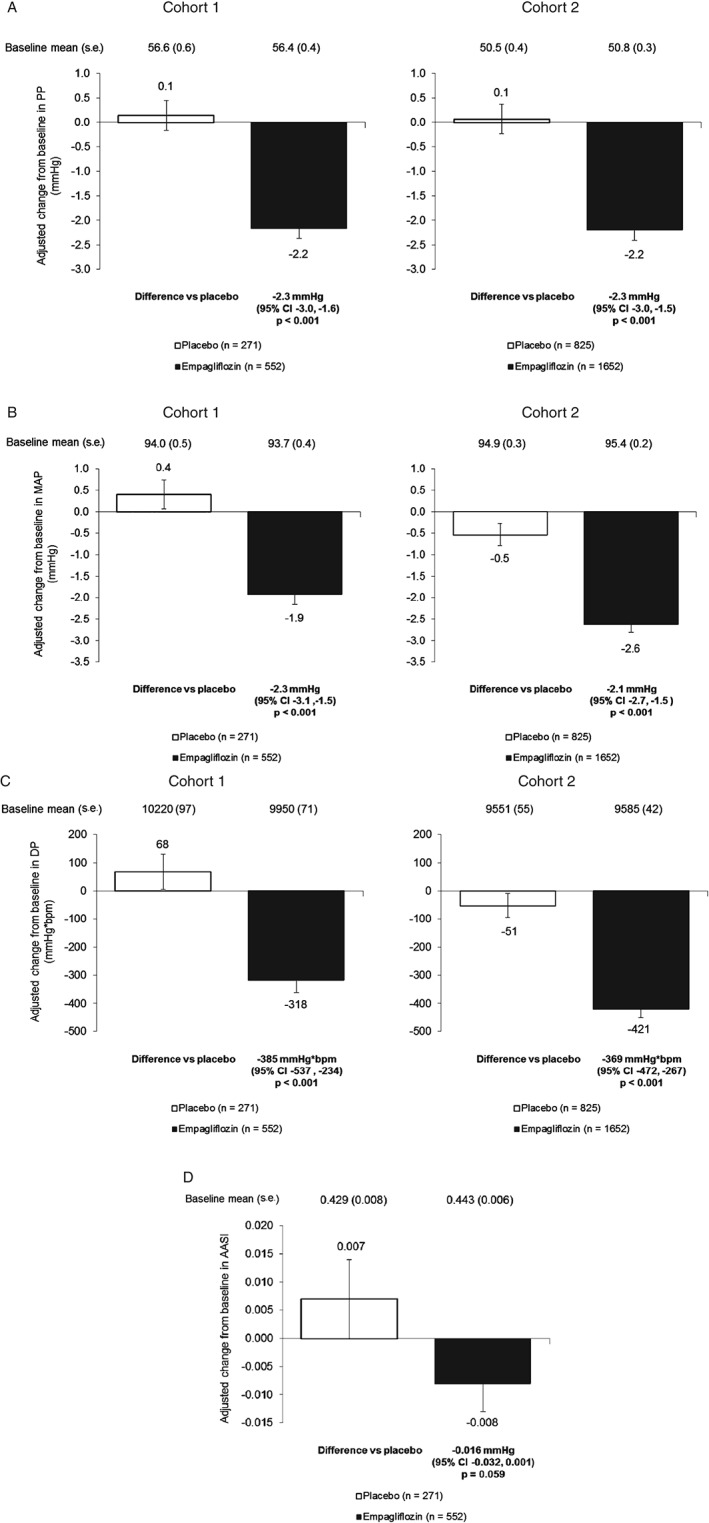
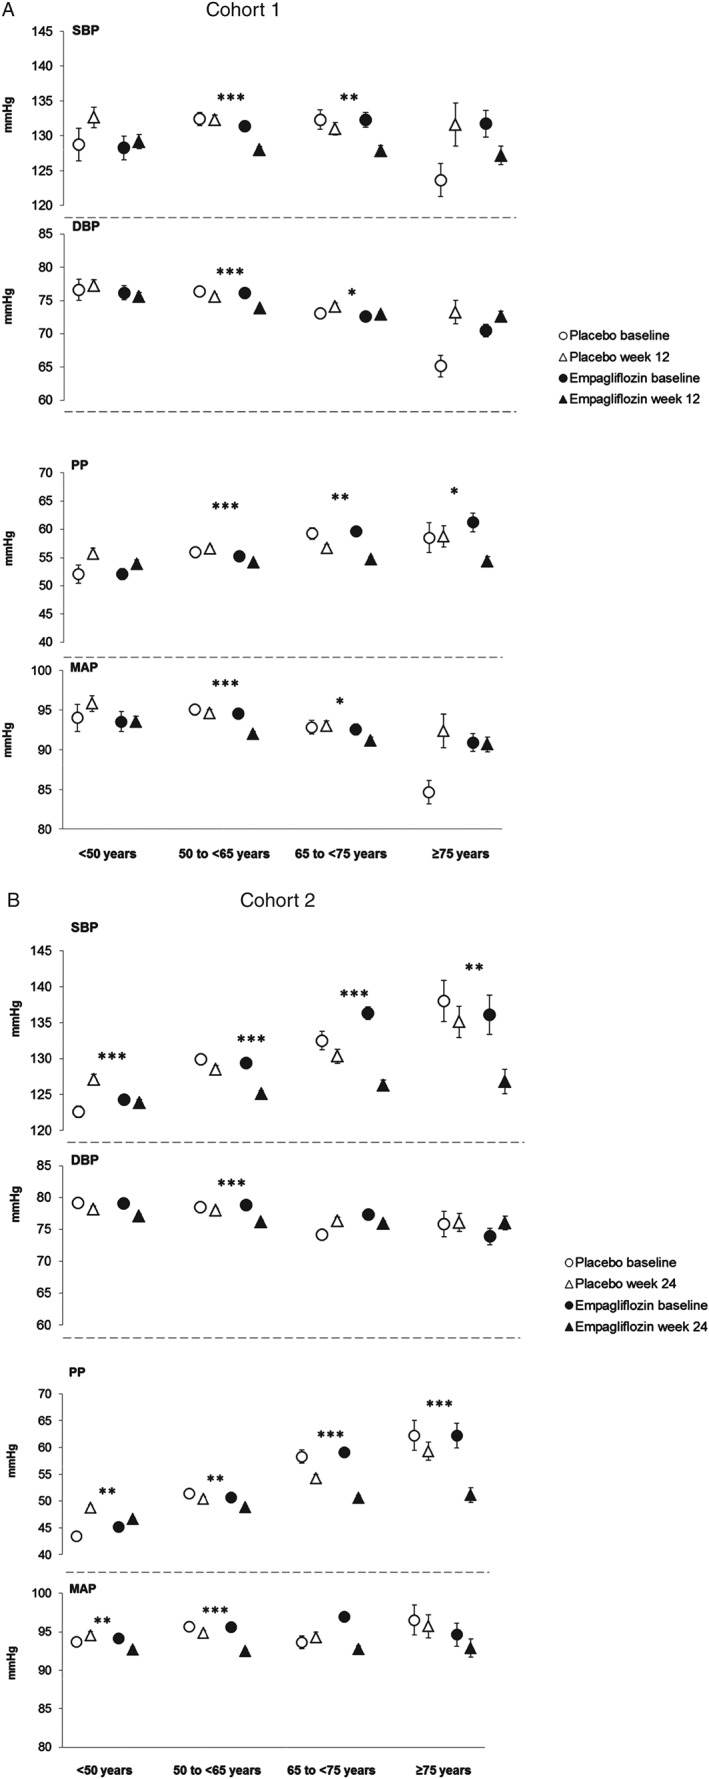
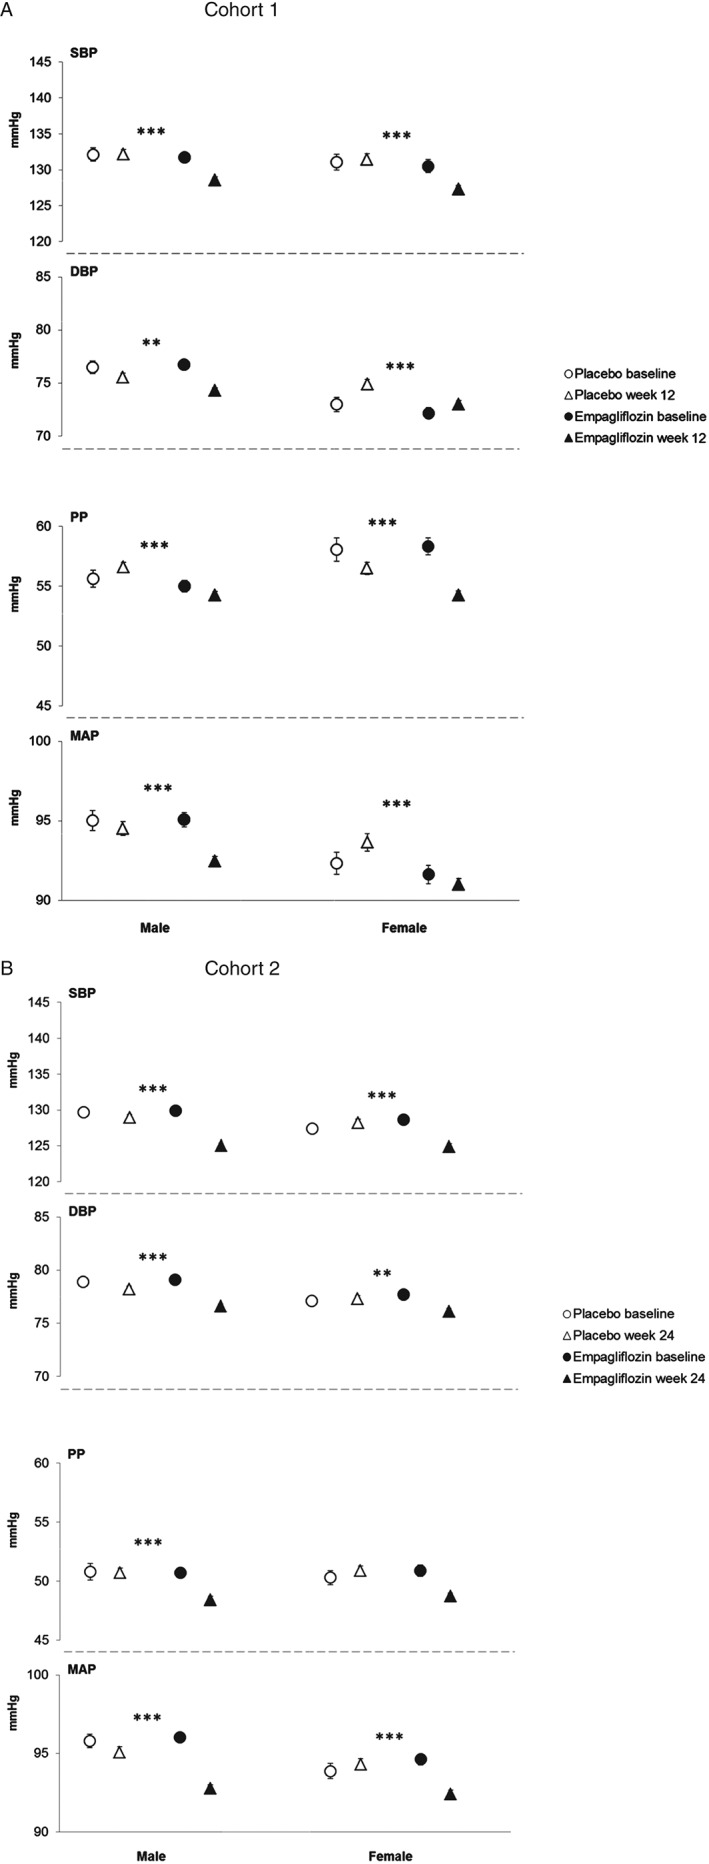
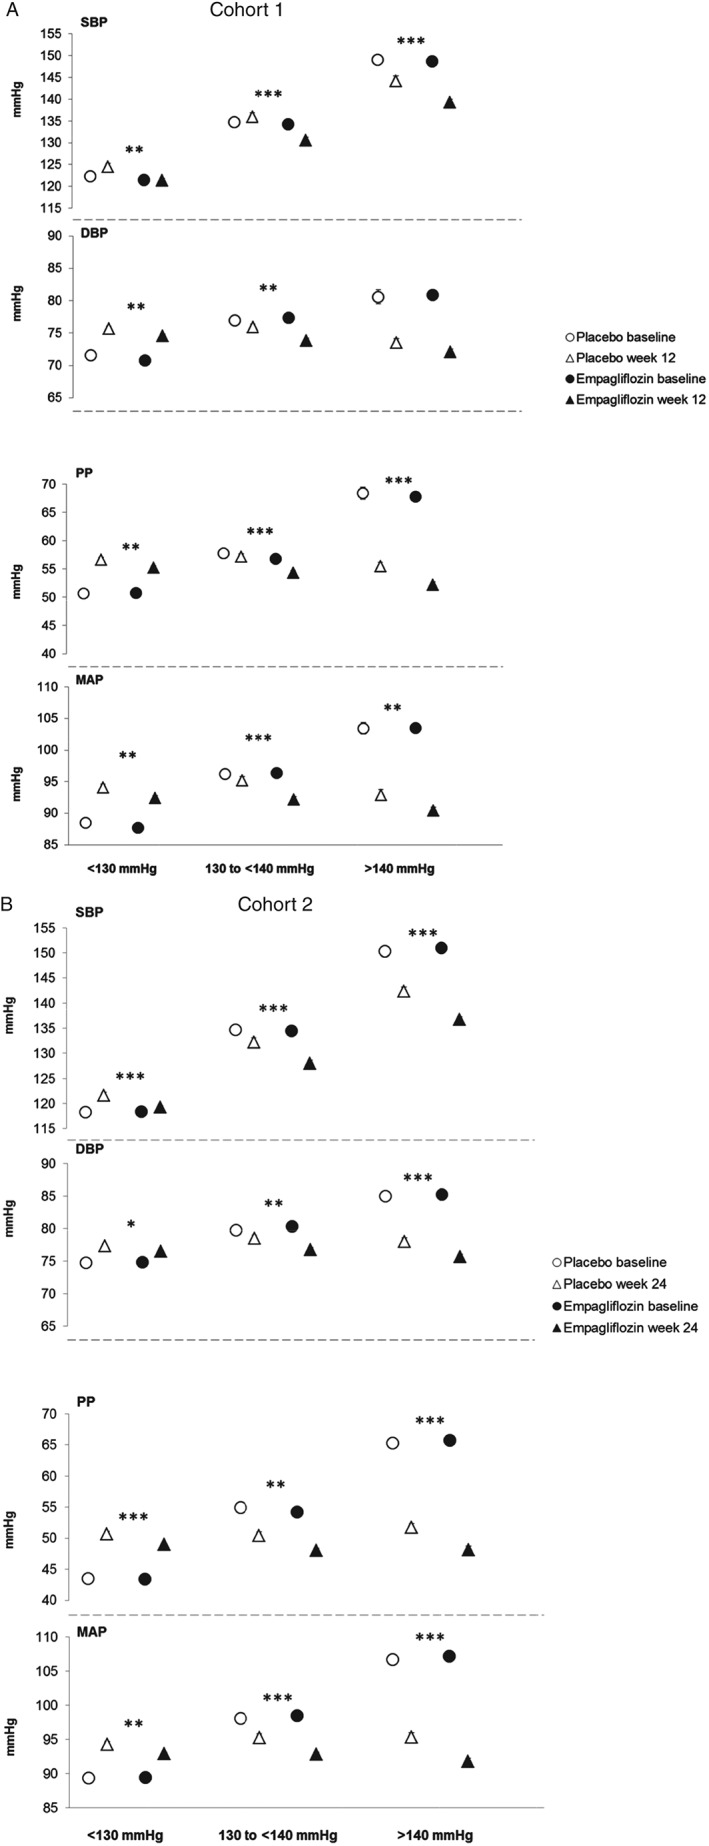
Results: Empagliflozin reduced systolic BP (SBP) and diastolic BP in both cohorts (p < 0.001 vs placebo), without increasing heart rate. Empagliflozin reduced pulse pressure (PP; adjusted mean difference vs placebo cohort 1: -2.3 mmHg; cohort 2: -2.3 mmHg), mean arterial pressure (MAP; cohort 1, -2.3 mmHg; cohort 2, -2.1 mmHg) and double product (cohort 1, -385 mmHg × bpm; cohort 2, -369 mmHg × bpm) all p < 0.001 vs placebo. There was a trend towards a reduction in the ambulatory arterial stiffness index (AASI) with empagliflozin in cohort 1 (p = 0.059 vs placebo). AASI was not measured in cohort 2. Subgroup analyses showed that there were greater reductions in PP with increasing baseline SBP in cohort 1 (p = 0.092). In cohort 2, greater reductions in MAP were achieved in patients with higher baseline SBP (p = 0.027) and greater reductions in PP were observed in older patients (p = 0.011).
Conclusions: Empagliflozin reduced BP and had favourable effects on markers of arterial stiffness and vascular resistance.
Keywords: SGLT2 inhibitor; cardiovascular disease; phase III study; type 2 diabetes.
© 2015 The Authors. Diabetes, Obesity and Metabolism published by John Wiley & Sons Ltd.
Figures
Similar articles
-
How does empagliflozin improve arterial stiffness in patients with type 2 diabetes mellitus? Sub analysis of a clinical trial.Cardiovasc Diabetol. 2019 Mar 29;18(1):44. doi: 10.1186/s12933-019-0839-8. Cardiovasc Diabetol. 2019. PMID: 30922297 Free PMC article. Clinical Trial.
-
Impact of empagliflozin on blood pressure in dipper and non-dipper patients with type 2 diabetes mellitus and hypertension.Diabetes Obes Metab. 2017 Nov;19(11):1620-1624. doi: 10.1111/dom.12962. Epub 2017 Jul 7. Diabetes Obes Metab. 2017. PMID: 28387058 Clinical Trial.
-
Effects of canagliflozin, a sodium glucose co-transporter 2 inhibitor, on blood pressure and markers of arterial stiffness in patients with type 2 diabetes mellitus: a post hoc analysis.Cardiovasc Diabetol. 2017 Feb 27;16(1):29. doi: 10.1186/s12933-017-0511-0. Cardiovasc Diabetol. 2017. PMID: 28241822 Free PMC article. Clinical Trial.
-
Potential role of sodium glucose cotransporter 2 inhibitors in the treatment of hypertension.Curr Opin Nephrol Hypertens. 2016 Mar;25(2):81-6. doi: 10.1097/MNH.0000000000000199. Curr Opin Nephrol Hypertens. 2016. PMID: 26808705 Review.
-
Impact of sodium-glucose cotransporter 2 inhibitors on blood pressure.Vasc Health Risk Manag. 2016 Oct 27;12:393-405. doi: 10.2147/VHRM.S111991. eCollection 2016. Vasc Health Risk Manag. 2016. PMID: 27822054 Free PMC article. Review.
Cited by
-
Potential Benefits of Sodium-Glucose Transporter-2 Inhibitors in the Symptomatic and Functional Status of Patients With Heart Failure: A Systematic Review and Meta-Analysis.Cureus. 2022 Sep 25;14(9):e29579. doi: 10.7759/cureus.29579. eCollection 2022 Sep. Cureus. 2022. PMID: 36312657 Free PMC article. Review.
-
Blood Pressure Effects of SGLT2 Inhibitors: Mechanisms and Clinical Evidence in Different Populations.Curr Hypertens Rep. 2023 Dec;25(12):429-435. doi: 10.1007/s11906-023-01281-1. Epub 2023 Nov 10. Curr Hypertens Rep. 2023. PMID: 37948021 Review.
-
Effect of Sodium-Glucose Cotransporter-2 Inhibitors on Endothelial Function: A Systematic Review of Preclinical Studies.Diabetes Ther. 2020 Sep;11(9):1947-1963. doi: 10.1007/s13300-020-00885-z. Epub 2020 Jul 27. Diabetes Ther. 2020. PMID: 32715425 Free PMC article. Review.
-
Empagliflozin and left ventricular diastolic function following an acute coronary syndrome in patients with type 2 diabetes.Int J Cardiovasc Imaging. 2021 Feb;37(2):517-527. doi: 10.1007/s10554-020-02034-w. Epub 2020 Sep 21. Int J Cardiovasc Imaging. 2021. PMID: 32959096
-
Empagliflozin reduces myocardial ketone utilization while preserving glucose utilization in diabetic hypertensive heart disease: A hyperpolarized 13 C magnetic resonance spectroscopy study.Diabetes Obes Metab. 2019 Feb;21(2):357-365. doi: 10.1111/dom.13536. Epub 2018 Oct 18. Diabetes Obes Metab. 2019. PMID: 30225964 Free PMC article.
References
-
- American Diabetes Association . Standards of medical care in diabetes‐2015. Diabetes Care 2015; 38(Suppl. 1): S1–93.
-
- [ESC/EASD] Task Force on Diabetes, Pre‐diabetes, and Cardiovascular Diseases of the European Society of Cardiology (ESC); European Association for the Study of Diabetes (EASD) , Rydén L, Grant PJ, Anker SD et al. ESC guidelines on diabetes, pre‐diabetes, and cardiovascular diseases developed in collaboration with the EASD–summary. Diab Vasc Dis Res 2014; 11: 133–173. - PubMed
-
- Creager MA, Lüscher TF, Cosentino F, Beckman JA. Diabetes and vascular disease: pathophysiology, clinical consequences, and medical therapy: part I. Circulation 2003; 108: 1527–1532. - PubMed
Publication types
MeSH terms
Substances
LinkOut - more resources
Full Text Sources
Other Literature Sources
Medical
Miscellaneous
