. 2015 Nov;243(1):19-29.
doi: 10.1016/j.atherosclerosis.2015.08.036. Epub 2015 Aug 29.

HIV infection induces structural and functional changes in high density lipoproteins

Affiliations

HIV infection induces structural and functional changes in high density lipoproteins

Marc O Siegel et al. Atherosclerosis. 2015 Nov.

Abstract

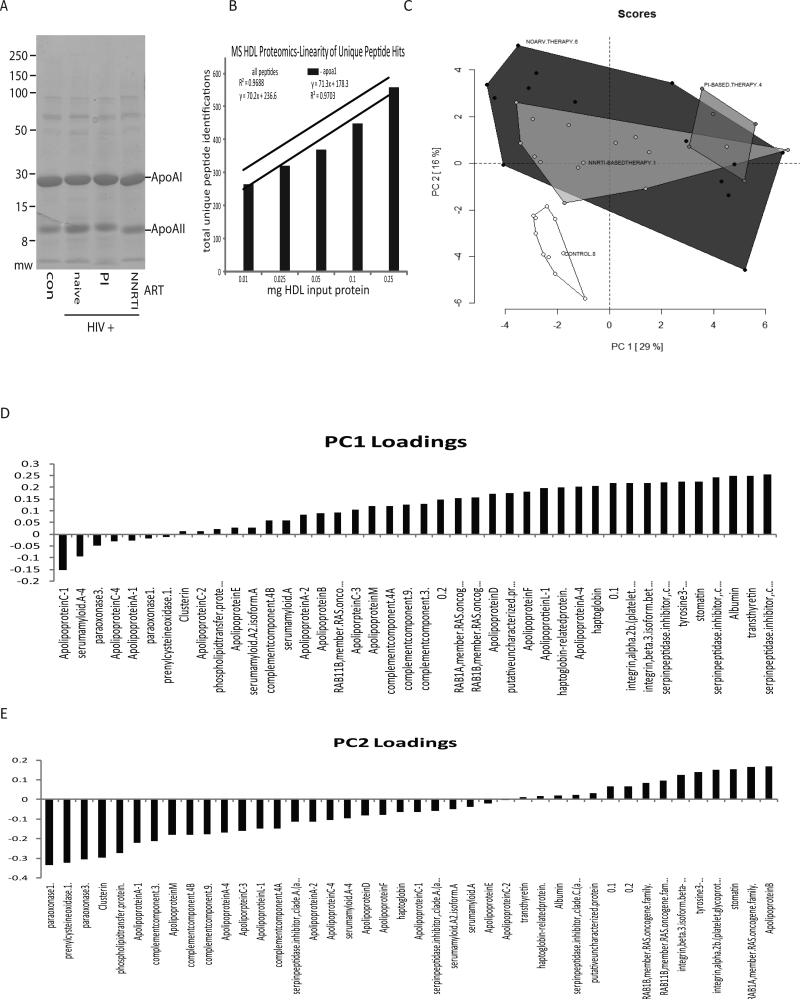
Background and aims: Coronary artery disease is a growing clinical problem in HIV-infected subjects. The increased risk of coronary events in this population has been linked to low levels of HDL, but the effects of HIV infection and anti-retroviral treatment (ART) on HDL structure and function remain unknown. Here, we aimed to determine the composition and function of HDL particles isolated from ART-naive and ART-positive HIV-infected patients.

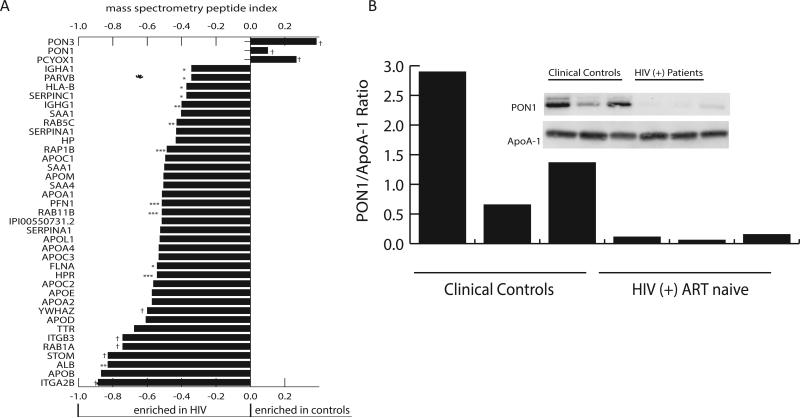
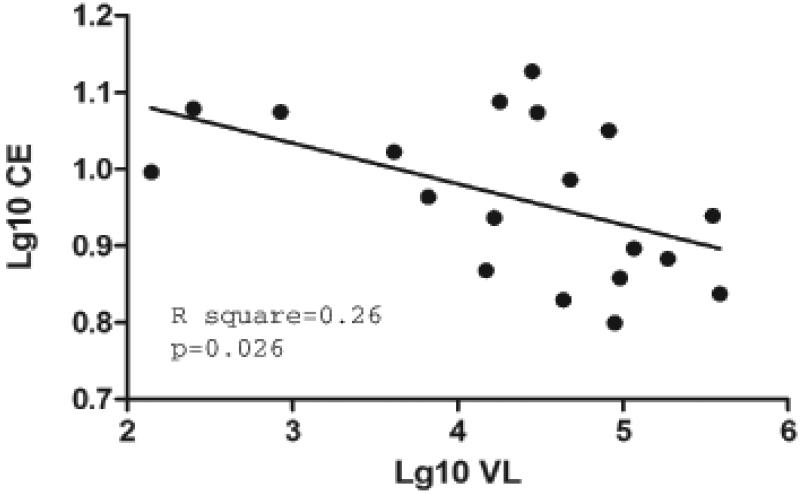
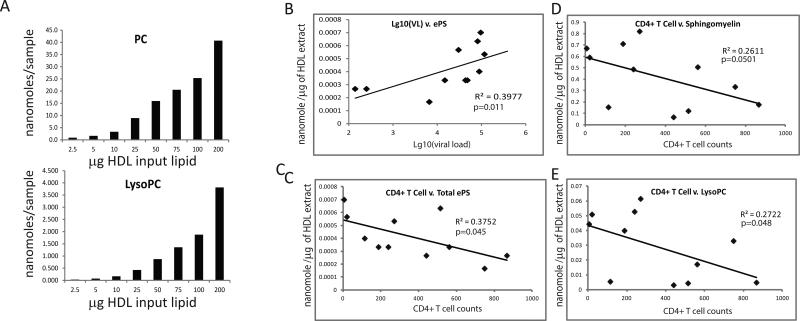
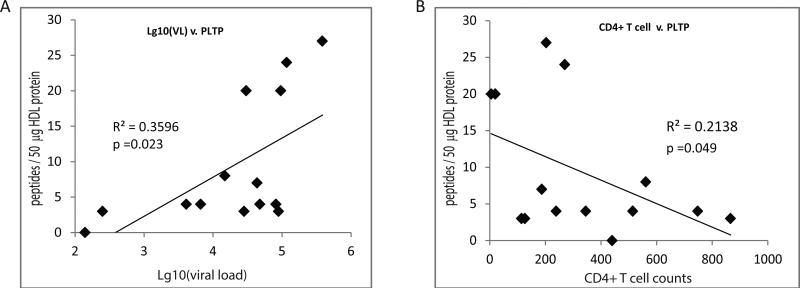
Methods and results: Proteomic profiling revealed decreased levels of paraoxonase (PON) 1 and PON 3 in HDL from HIV patients relative to HDL from uninfected controls (p < 0.0001), and PON activity of HDL from control group (0.13 ± 0.01 U/μl) was significantly higher than PON activity of HDL from HIV-infected untreated subjects (0.12 ± 0.01 U/μl, p = 0.0035), subjects treated with non-nucleoside reverse transcriptase inhibitor (NNRTI)-based therapy (0.11 ± 0.01 U/μl, p < 0.0001), subjects treated with protease inhibitor (PI)-based therapy with detectable viral load (0.11 ± 0.01 U/μl, p < 0.0001), and PI-treated patients with undetectable viral load (0.12 ± 0.01 U/μl, p = 0.0164). Lipidomic profiling uncovered a negative correlation between CD4 T cell counts and particle sphingomyelin, lyso-phosphatidylcholine and ether-linked phosphatidylserine content in the ART-naive (R(2) = 0.2611, p < 0.05; R(2) = 0.2722, p < 0.05; and R(2) = 0.3977, p < 0.05, respectively) but not treated HIV-infected subjects. Functional analysis demonstrated a negative correlation between cholesterol efflux capacity of HDL and viral load in the ART-naive HIV-infected group (R(2) = 0.26, p = 0.026).

Conclusions: Taken together, these results indicate that HIV infection associates with a number of both protein and lipid compositional changes in HDL particles. Moreover, HIV infection affects cholesterol efflux function of HDL, thus contributing to an increased risk of atherosclerosis in this patient population.

Keywords: Anti-retroviral treatment; Atherosclerosis; Cholesterol efflux; HDL; HIV; Lipidomics; PON; Proteomics.


Figures

Figure 1
Figure 1. Proteomic profiling of HDL particles
A - Purified HDLs from the indicated groups were acetone precipitated and analyzed by SDS-PAGE. Panel shows representative lanes from the sample run. B - Graph shows a linear response of total and ApoA-I peptide identifications with increasing amounts of input total HDL protein. C - Principal component analysis of all analyzed samples (n=45) indicates a significant separation in the proteomic content of the control HDL particles versus the HDL particles isolated from HIV-positive individuals. Scores from PC1 and PC2 explained 45% of the total variance within the data set. Loading plots from both PC1 and PC2 are also presented to illustrate variables driving separation of experimental groups. The PCA plot shown was used as a tool for data exploration. D and E - Proteins associated with the two principal components affecting the separation of the groups.
Figure 2
Figure 2. Analysis of PON in HDL particles
A - Peptide indices for HDL associated proteins that showed marked differences between control and HIV infected samples. Positive scores indicate a greater abundance of the protein in the HDL from control samples, while negative scores indicate a greater abundance of the protein in the HDL from HIV-positive subjects. Peptide indices of the uninfected controls and HIV-positive samples were compared via a Student's t-test. * indicates significance at the p=0.05 level, ** indicates significance at the p=0.01 level, *** indicates significance at the p=0.001 level, and † indicates significance with p<0.0001. All p values were Bonferroni corrected for multiple tests (n=163 comparisons). B - Analysis of PON1 and apoA-1 levels by Western blotting in HDL from 3 controls and 3 HIV-positive ART-naïve subjects.
Figure 3
Figure 3. Analysis of colesterol efflux to isolated HDL
Spearman correlation analysis between viral load and cholesterol eflux to isolated HDL was performed on samples from ART-naïve group. Cholesterol efflux was measured in THP-1 cells incubated with HDL (20 μg/ml) as described in Materials and Methods.
Figure 4
Figure 4. Analysis of lipids in HDL particles
A - Graphs show that both PC and lysoPC levels are detected in a linear manner with increasing amount of input total HDL lipid. B-E - Spearman correlation analyses of the indicated lipid species relative to viral load and CD4+ T cell counts in the HIV-positive ART-naïve samples.
Figure 5
Figure 5. Spearman correlation analysis of HDL PLTP
Graphs show significant correlations between the level of HDL-associated PLTP peptides and viral load (A) or CD4+ T cell counts (B) in the HIV-positive ART-naïve subjects.
Figure 6
Figure 6. Analysis of oxidized lipid in HDL and LDL
A – Graph shows levels of oxidized PC species in HIV+ ART-naïve (n=5) and HIV+ NNRTI-treated subjects with completely suppressed viremia (n=5). Data are presented as mean ± SEM, * - significant p values are shown above the bars. Lipid acyl side chains: 1 - oxovaleric, 2 - oxo-nonanoic, 3 - hydroxy-octadecadienoic, 4 - hydroxy-octadecenoic, 5 - hydroperoxy-octadecadienoic, 6 - unknown. B - Graph shows the ratio of oxLDL to LDL in samples from HIV+ ART-naïve (n=10), HIV+ NNRTI-treated (n=11), and HIV+ PI-treated (10). Data are presented as mean ± SEM, the difference between untreated and NNRTI-treated groups is significant (p=0.023).

Similar articles

Cited by

References

    1. Escaut L, Monsuez JJ, Chironi G, et al. Coronary artery disease in HIV infected patients. Intensive Care Med. 2003;29:969–973. - PubMed
    1. Lang S, Mary-Krause M, Cotte L, et al. Increased risk of myocardial infarction in HIV-infected patients in France, relative to the general population. AIDS. 2010;24:1228–1230. - PubMed
    1. Triant VA, Lee H, Hadigan C, et al. Increased acute myocardial infarction rates and cardiovascular risk factors among patients with human immunodeficiency virus disease. J Clin Endocrinol Metab. 2007;92:2506–2512. - PMC - PubMed
    1. Kwong GP, Ghani AC, Rode RA, et al. Comparison of the risks of atherosclerotic events versus death from other causes associated with antiretroviral use. AIDS. 2006;20:1941–1950. - PubMed
    1. Strategies for Management of Anti-Retroviral Therapy I and Groups DADS. Use of nucleoside reverse transcriptase inhibitors and risk of myocardial infarction in HIV-infected patients. AIDS. 2008;22:F17–24. - PMC - PubMed

Publication types