. 2015 Oct 6;22(4):682-94.
doi: 10.1016/j.cmet.2015.07.028. Epub 2015 Sep 3.

Loss of Mitochondrial Pyruvate Carrier 2 in the Liver Leads to Defects in Gluconeogenesis and Compensation via Pyruvate-Alanine Cycling

Affiliations

Loss of Mitochondrial Pyruvate Carrier 2 in the Liver Leads to Defects in Gluconeogenesis and Compensation via Pyruvate-Alanine Cycling

Kyle S McCommis et al. Cell Metab. .

Abstract

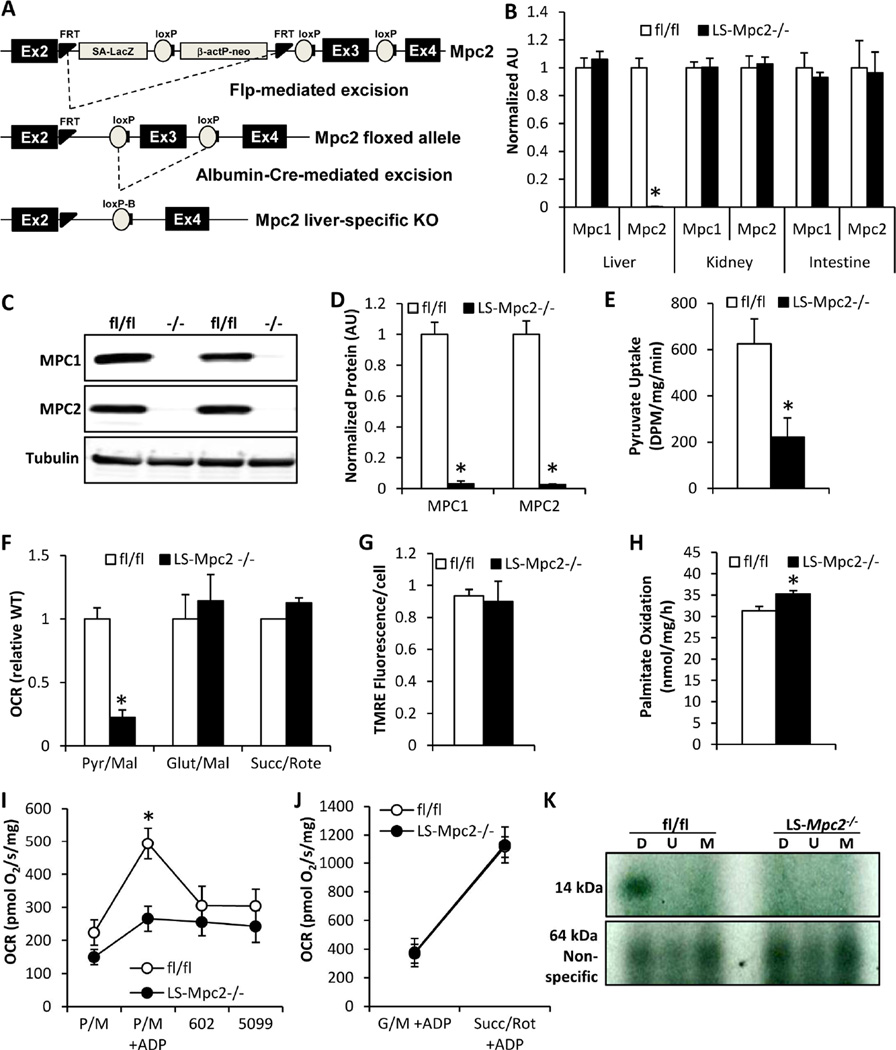
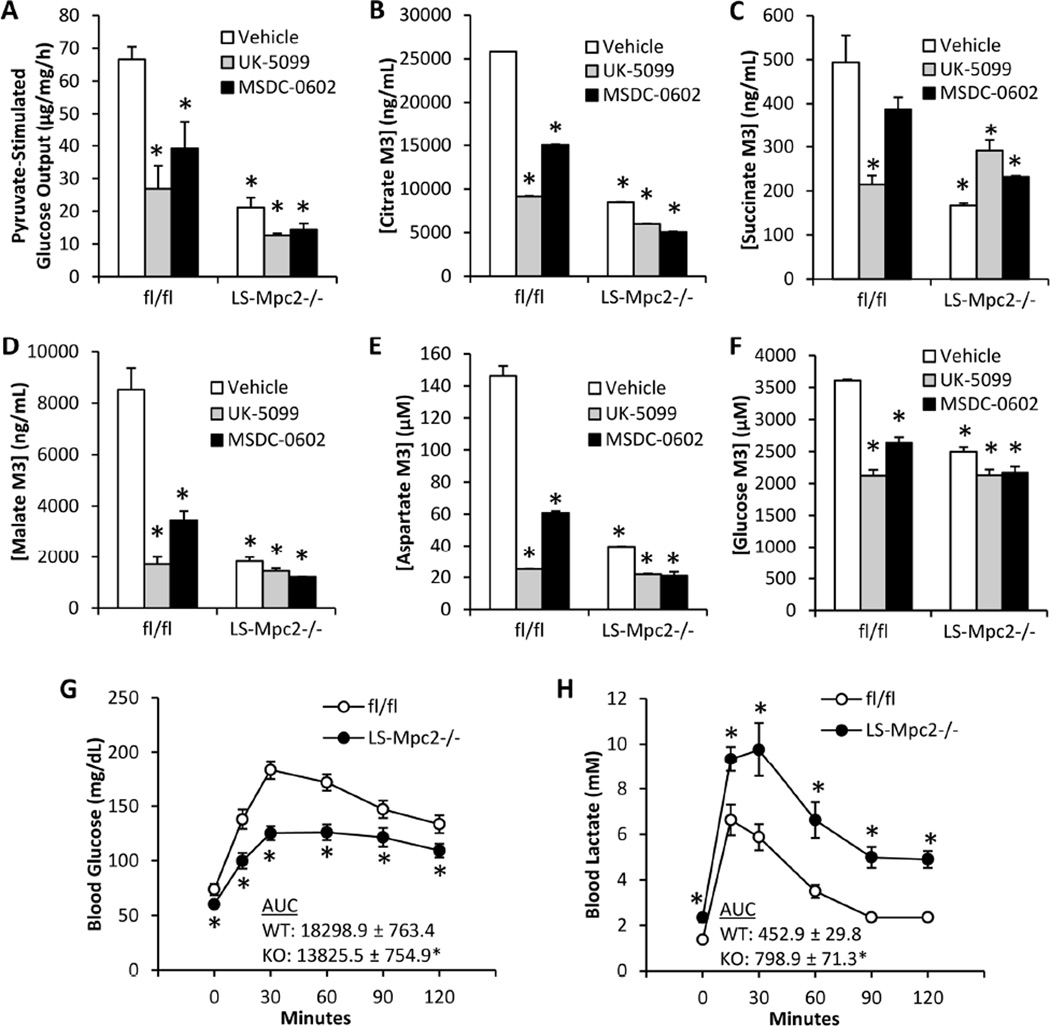
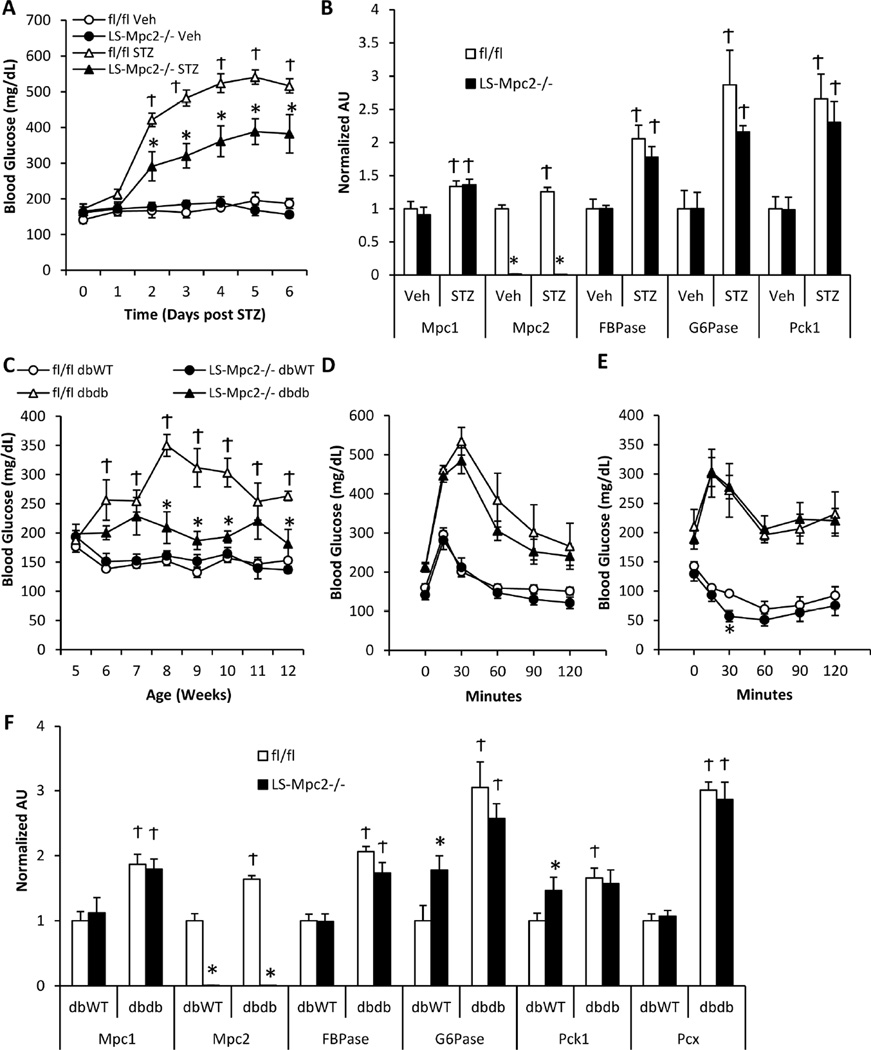
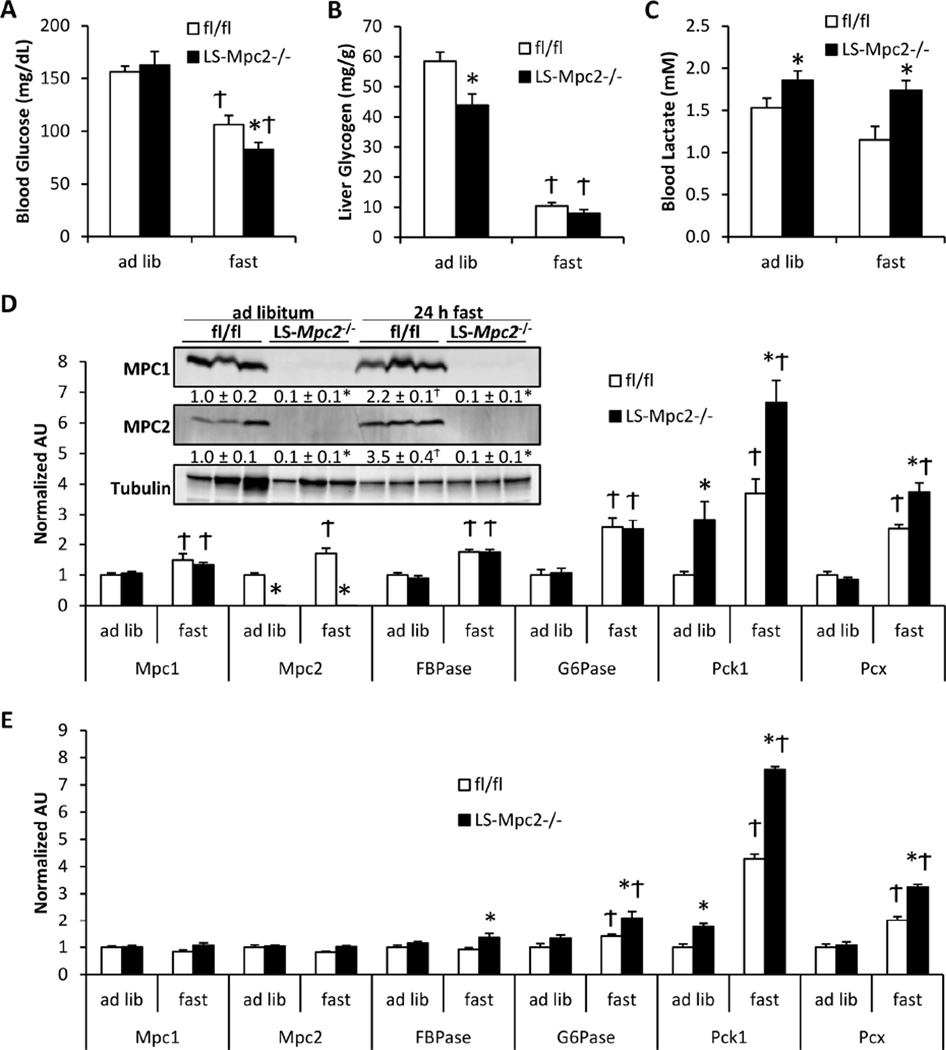
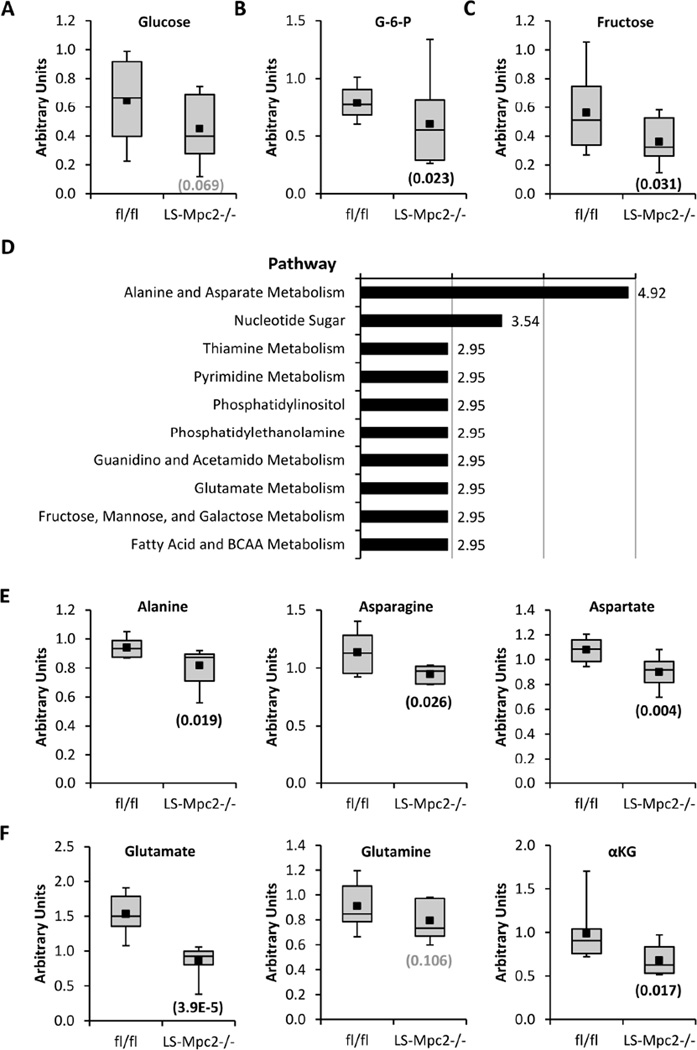
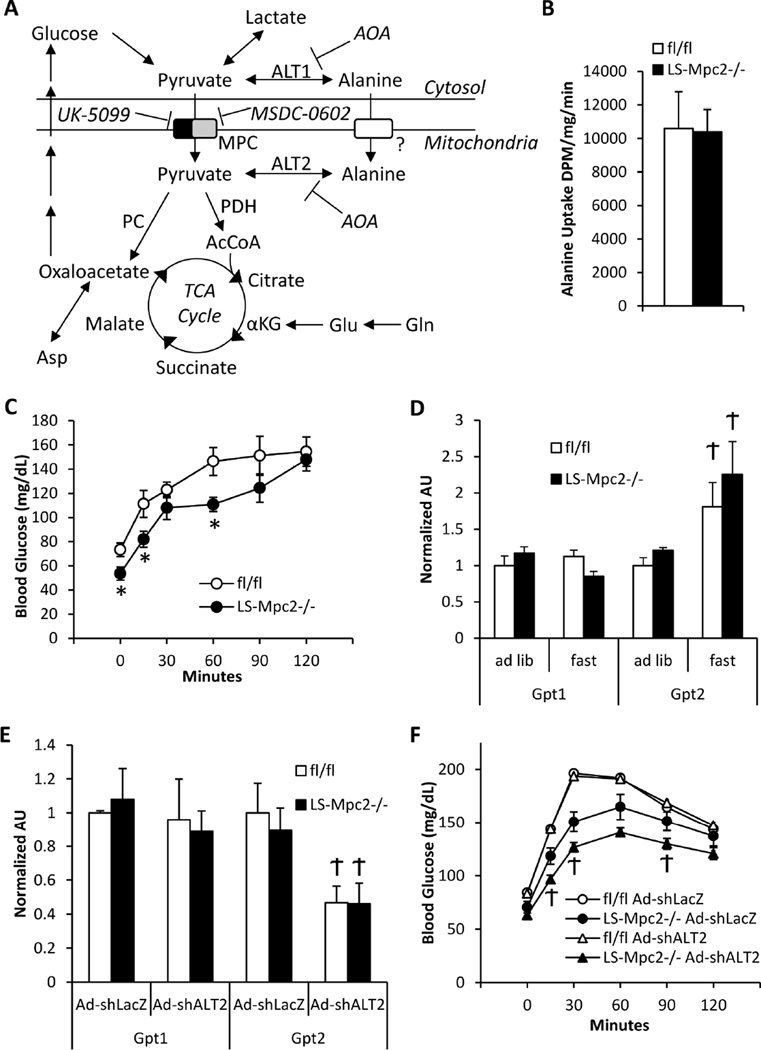
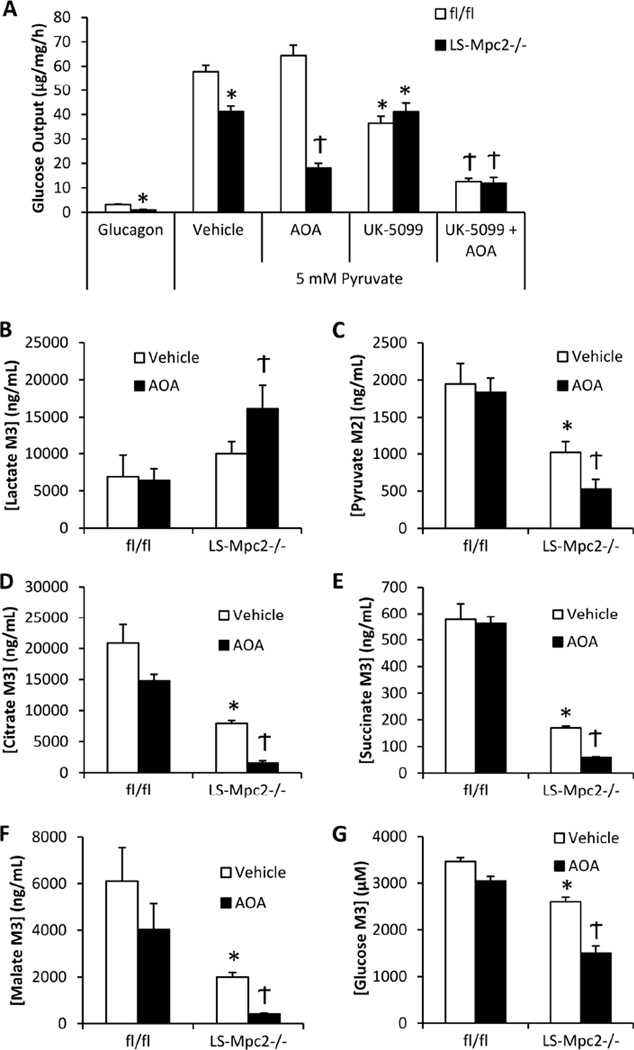
Pyruvate transport across the inner mitochondrial membrane is believed to be a prerequisite for gluconeogenesis in hepatocytes, which is important for the maintenance of normoglycemia during prolonged food deprivation but also contributes to hyperglycemia in diabetes. To determine the requirement for mitochondrial pyruvate import in gluconeogenesis, mice with liver-specific deletion of mitochondrial pyruvate carrier 2 (LS-Mpc2(-/-)) were generated. Loss of MPC2 impaired, but did not completely abolish, hepatocyte conversion of labeled pyruvate to TCA cycle intermediates and glucose. Unbiased metabolomic analyses of livers from fasted LS-Mpc2(-/-) mice suggested that alterations in amino acid metabolism, including pyruvate-alanine cycling, might compensate for the loss of MPC2. Indeed, inhibition of pyruvate-alanine transamination further reduced mitochondrial pyruvate metabolism and glucose production by LS-Mpc2(-/-) hepatocytes. These data demonstrate an important role for MPC2 in controlling hepatic gluconeogenesis and illuminate a compensatory mechanism for circumventing a block in mitochondrial pyruvate import.


Figures

Figure 1
Figure 1. Generation and characterization of LS Mpc2−/− mice
(A) Gene-targeting strategy to delete exon 3 of Mpc2 in a liver-specific manner by Cre-recombinase expressed under the control of the albumin promoter. (B) Expression of Mpc1 and Mpc2 mRNA in liver, kidney, and intestine in fl/fl and LS-Mpc2−/− mice. (C) Representative western blot images for MPC2 and MPC1 protein in isolated hepatocytes. (D) Quantification of MPC1 and MPC2 protein expression in isolated hepatocytes as in (C). (E) Uptake of 14C-pyruvate by isolated mitochondria. (F) ADP-supported oxygen consumption rates by isolated, permeabilized hepatocytes in the presence of the indicated substrates. (G) Mitochondrial membrane potential in LS-Mpc2−/− and fl/fl hepatocytes as assessed by TMRE staining. (H) Oxidation of 3H-palmitate in LS-Mpc2−/− and fl/fl hepatocytes. (I) Oxygen consumption rates of isolated mitochondria from fl/fl and LS-Mpc2−/− livers stimulated by 5 mM pyruvate and 2 mM malate before and after addition of 15 µM MSDC-0602 or 10 µM UK-5099. (J) Oxygen consumption rates of isolated mitochondria stimulated by 10 mM glutamate/2 mM malate or 5 mM succinate/0.5 µM rotenone. Data presented as mean + S.E.M. *p ≤ 0.05 for fl/fl vs LS-Mpc2−/−. (K) Photoaffinity crosslinking of an iodinated 125I-TZD photoprobe, MSDC-1101, specifically labels a 14 kDa protein in vehicle-treated (labeled D for DMSO) fl/fl hepatocyte mitochondrial membranes. Co-incubation with 30 µM unlabeled UK-5099 (labeled U) or MSDC-0602 (labeled M) prevent the labeling.
Figure 2
Figure 2. Decreased mitochondrial pyruvate metabolism and glucose production with chemical or genetic MPC inhibition
(A) Glucose concentrations in the media of cultured hepatocytes after stimulation by glucagon and 5 mM pyruvate in the presence or absence of UK-5099 (2.5 µM) or MSDC-0602 (15 µM). (B–F) 13C-pyruvate flux into cellular (B) citrate, (C) succinate, (D) malate, (E) aspartate, or (F) medium glucose measured by mass spectrometry in fl/fl and LS-Mpc2−/− hepatocytes. (G) Blood glucose concentrations after overnight fast and throughout a pyruvate tolerance test (PTT). (H) Blood lactate concentrations after overnight fast and throughout a PTT. Data presented as mean + S.E.M. *p ≤ 0.05 vs vehicle-treated fl/fl hepatocytes.
Figure 3
Figure 3. LS Mpc2−/− mice are protected from hyperglycemia
(A) Blood glucose concentrations after induction of streptozotocin (STZ)-induced insulin deficiency in ad libitum fed mice. (B) mRNA expression from livers of vehicle or STZ-injected mice. Data presented as mean + S.E.M. *p ≤ 0.05 for fl/fl vs LS-Mpc2−/−. Ϯp ≤ 0.05 for STZ and vehicle. (C) Blood glucose concentrations in ad libitum fed fl/fl or LS-Mpc2−/− mice crossed into the db/db background. (D) Blood glucose concentrations during an i.p. glucose tolerance test. (E) Blood glucose concentrations during an i.p. insulin tolerance test. (F) mRNA expression from livers of fl/fl or LS-Mpc2−/− mice crossed into the db/db background. Data presented as mean + S.E.M. *p ≤ 0.05 for fl/fl vs LS-Mpc2−/−. Ϯp ≤ 0.05 for db/WT vs db/db.
Figure 4
Figure 4. Fasting response of LS Mpc2−/− mice
LS-Mpc2−/− and fl/fl mice were either given ad libitum access to food or fasted 24 h. Graphs depict (A) blood glucose concentration, (B) liver glycogen, and (C) blood lactate concentration. (D) qRT-PCR analyses in livers from fed vs. fasted fl/fl and LS-Mpc2−/− mice. Inset: western blot of liver lysates from fed and fasted mice, with quantification in text below blot. (E) qRT-PCR analyses of kidneys from fed vs. fasted fl/fl and LS-Mpc2−/− mice. Data presented as mean + S.E.M. *p ≤ 0.05 for fl/fl vs. LS-Mpc2−/−. Ϯp ≤ 0.05 for fed vs fasted.
Figure 5
Figure 5. Metabolomic analyses of fasted fl/fl and LS-Mpc2−/− livers
Liver (A) glucose, (B) glucose-6-phosphate (G-6-P), and (C) fructose content in fasted LS-Mpc2−/− compared to fl/fl mice. (D) Metabolic pathways that were most significantly affected by genotype in fasted mouse liver. (E) Alanine, asparagine, and aspartate content and (F) glutamate, glutamine, and alpha-ketoglutarate (αKG), content in fasted LS-Mpc2−/− and fl/fl livers. Data presented as box and whisker plot with minus error bar as the minimum of distribution, bottom of box as lower quartile, line bisecting the box as the median, the black square as the mean, the top of the box as the upper quartile, and the positive error bar as the maximum of distribution. Number in parentheses is p value for fasted fl/fl vs LS-Mpc2−/− liver metabolite.
Figure 6
Figure 6. Gluconeogenesis from alanine is normal in LS-Mpc2−/− mice
(A) Schematic depicting mitochondrial alanine metabolism during defective mitochondrial pyruvate transport. (B) Alanine uptake by isolated mitochondria from fl/fl and LS-Mpc2−/− livers. (C) Blood glucose concentrations after i.p. L-alanine injection during an alanine tolerance test (ATT). (D) qRT-PCR analyses for Gpt1 and Gpt2 in fed vs. fasted livers. (E) Liver qRT-PCR analyses after injection of control adenovirus encoding an shRNA against LacZ (Ad-shLacZ) or adenovirus expressing an shRNA against Gpt2 (Ad-shALT2). (F) PTT analysis performed 5 days after in vivo knockdown of ALT2. Data represented as mean ± S.E.M. *p ≤ 0.05 for fl/fl vs. LS-Mpc2−/−. Ϯp ≤ 0.05 for fed vs. fasted or for Ad-shLacZ vs Ad-shALT2.
Figure 7
Figure 7. Pyruvate transamination to alanine compensates for decreased mitochondrial pyruvate transport in LS-Mpc2−/− hepatocytes
(A) Glucose production from pyruvate by LS-Mpc2−/− and fl/fl hepatocytes cultured in the presence or absence of the alanine transaminase inhibitor amino-oxyacetate (AOA; 500 µM) and/or UK-5099. (B–G) U13C-pyruvate flux into lysate (B) lactate, (C) M2 pyruvate, (D) citrate, (E) succinate, (F) malate, or (G) medium glucose measured by mass spectrometry using LS-Mpc2−/− and fl/fl hepatocytes cultured in the presence or absence of AOA. Data expressed as mean + S.E.M. *p ≤ 0.05 for fl/fl vs. LS-Mpc2−/−. Ϯp ≤ 0.05 for vehicle vs AOA.

Comment in

Similar articles

Cited by

References

    1. Adams MD, Raman P, Judd RL. Comparative effects of englitazone and glyburide on gluconeogenesis and glycolysis in the isolated perfused rat liver. Biochemical pharmacology. 1998;55:1915–1920. - PubMed
    1. Bricker DK, Taylor EB, Schell JC, Orsak T, Boutron A, Chen YC, Cox JE, Cardon CM, Van Vranken JG, Dephoure N, et al. A mitochondrial pyruvate carrier required for pyruvate uptake in yeast, Drosophila, and humans. Science. 2012;337:96–100. - PMC - PubMed
    1. Burgess SC, Leone TC, Wende AR, Croce MA, Chen Z, Sherry AD, Malloy CR, Finck BN. Diminished hepatic gluconeogenesis via defects in tricarboxylic acid cycle flux in peroxisome proliferator-activated receptor gamma coactivator-1alpha (PGC-1alpha)-deficient mice. The Journal of biological chemistry. 2006;281:19000–19008. - PMC - PubMed
    1. Casetta B, Tagliacozzi D, Shushan B, Federici G. Development of a method for rapid quantitation of amino acids by liquid chromatography-tandem mass spectrometry (LC-MSMS) in plasma. Clinical chemistry and laboratory medicine : CCLM / FESCC. 2000;38:391–401. - PubMed
    1. Chen Z, Gropler MC, Norris J, Lawrence JC, Jr, Harris TE, Finck BN. Alterations in hepatic metabolism in fld mice reveal a role for lipin 1 in regulating VLDL-triacylglyceride secretion. Arterioscler Thromb Vasc Biol. 2008;28:1738–1744. - PMC - PubMed

Publication types

MeSH terms