. 2015 Oct 6;22(4):669-81.
doi: 10.1016/j.cmet.2015.07.027. Epub 2015 Sep 3.

Hepatic Mitochondrial Pyruvate Carrier 1 Is Required for Efficient Regulation of Gluconeogenesis and Whole-Body Glucose Homeostasis

Affiliations

Hepatic Mitochondrial Pyruvate Carrier 1 Is Required for Efficient Regulation of Gluconeogenesis and Whole-Body Glucose Homeostasis

Lawrence R Gray et al. Cell Metab. .

Abstract

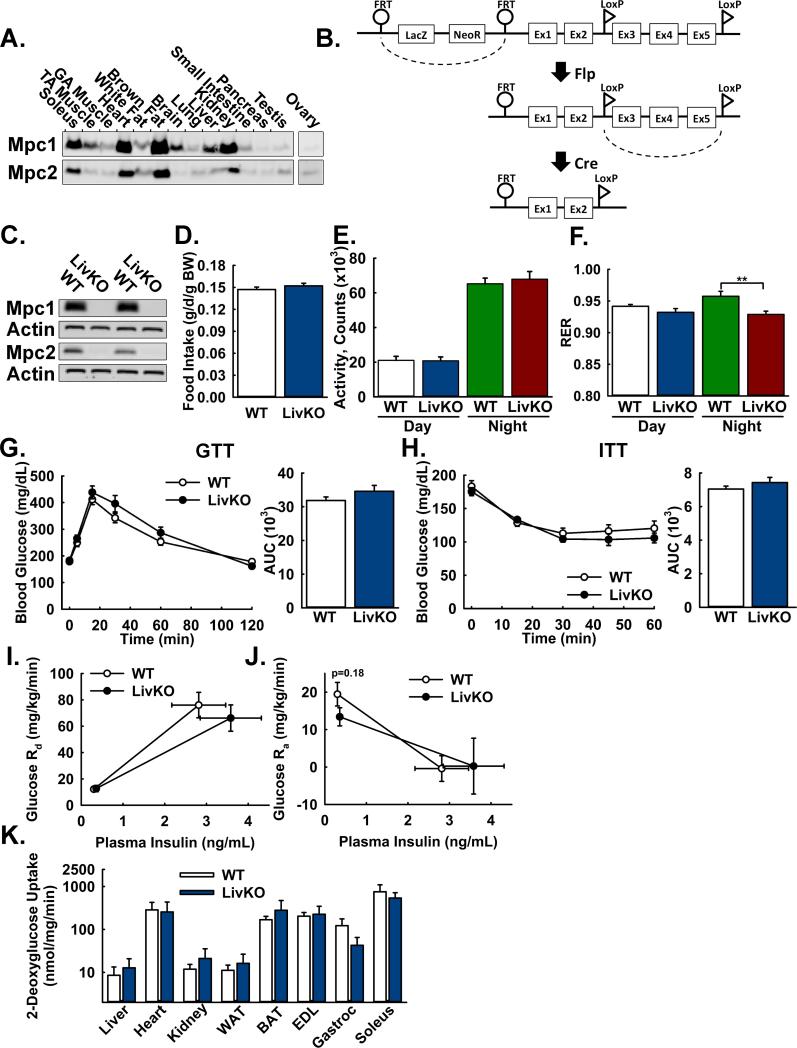
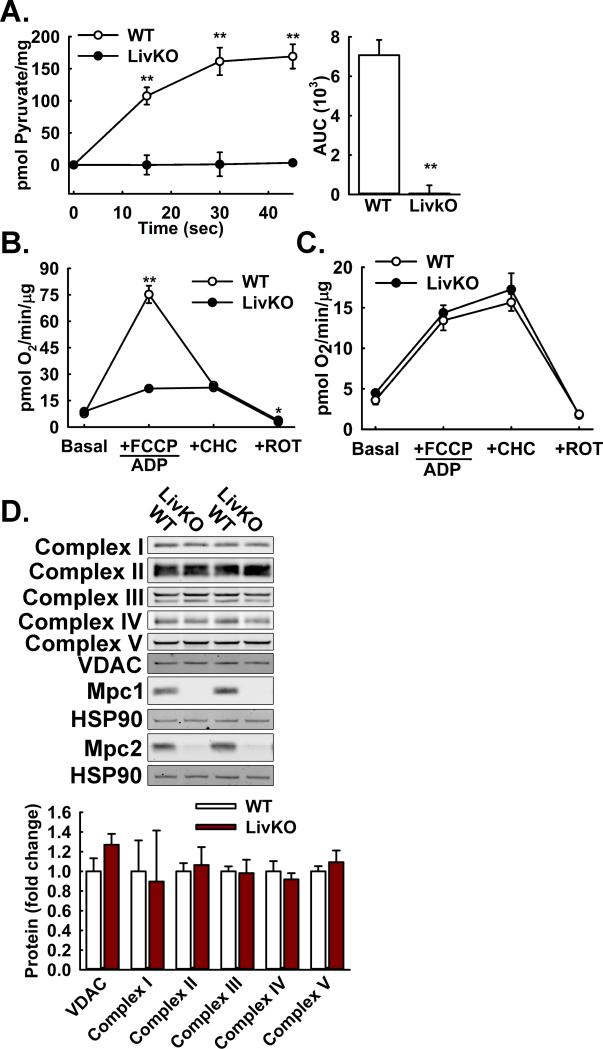
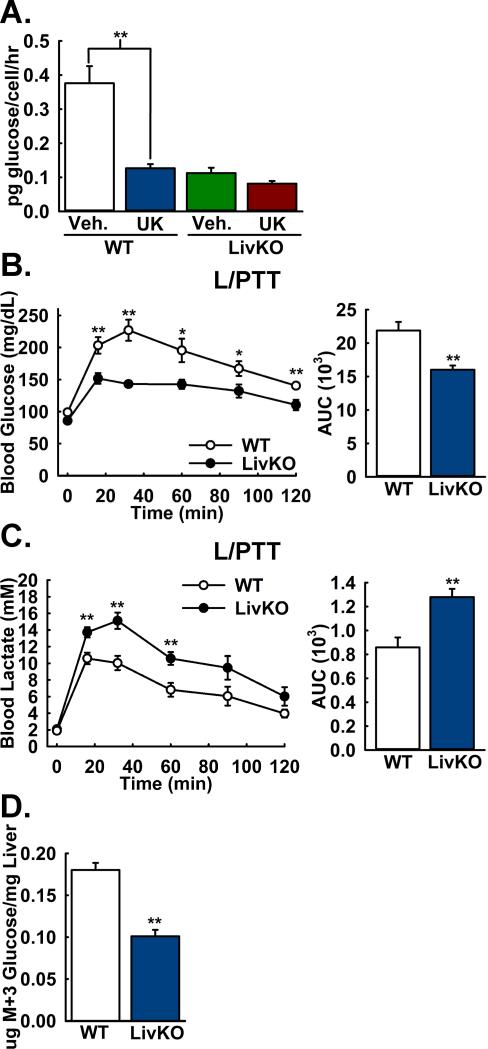
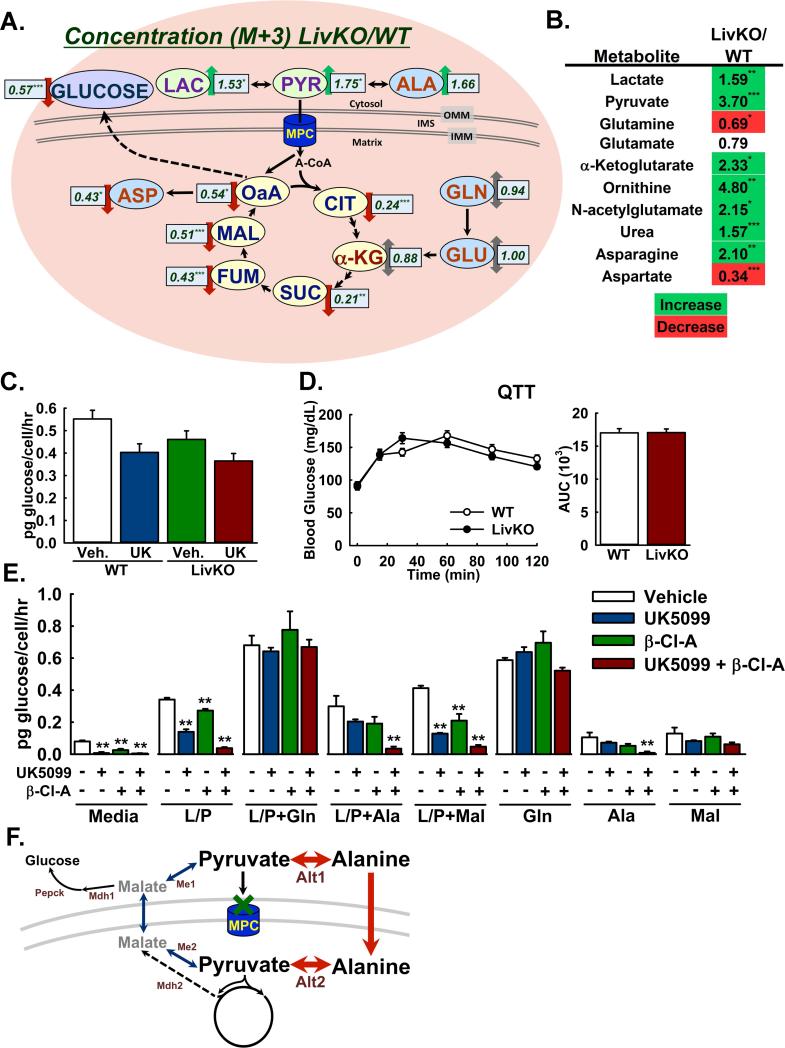
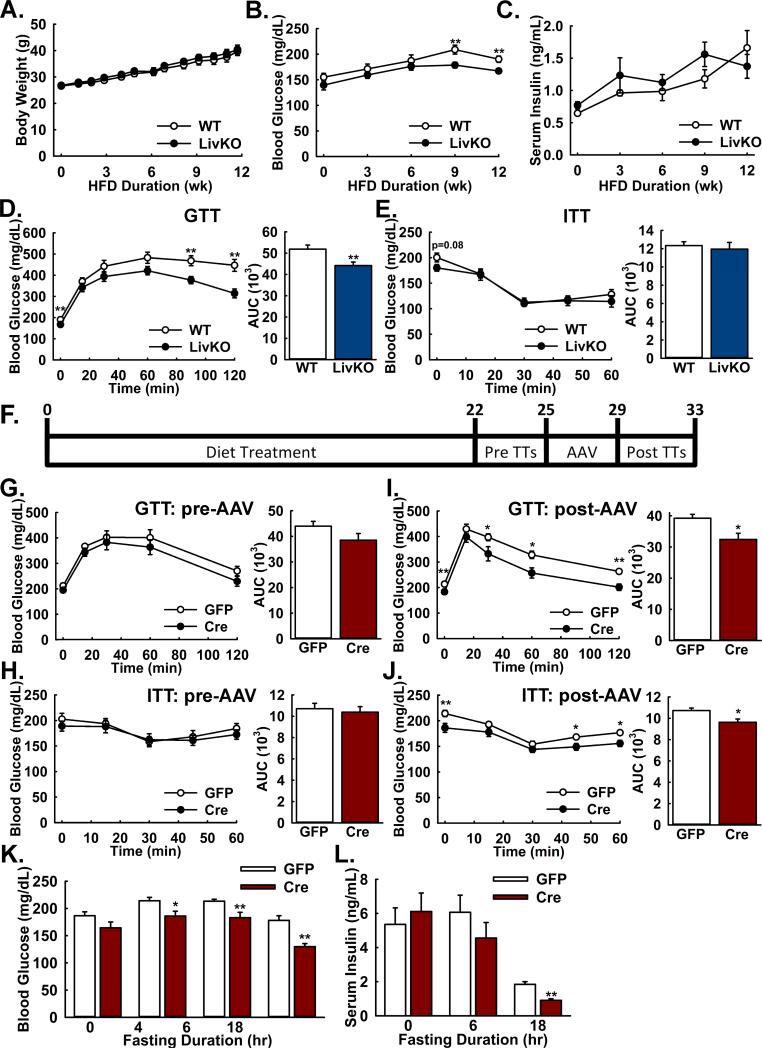
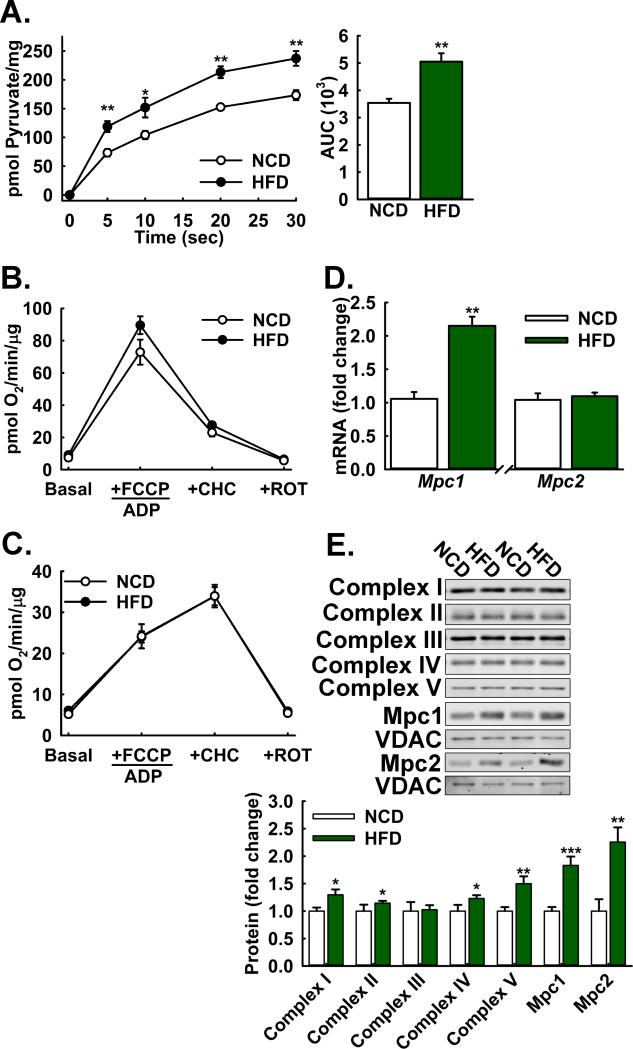
Gluconeogenesis is critical for maintenance of euglycemia during fasting. Elevated gluconeogenesis during type 2 diabetes (T2D) contributes to chronic hyperglycemia. Pyruvate is a major gluconeogenic substrate and requires import into the mitochondrial matrix for channeling into gluconeogenesis. Here, we demonstrate that the mitochondrial pyruvate carrier (MPC) comprising the Mpc1 and Mpc2 proteins is required for efficient regulation of hepatic gluconeogenesis. Liver-specific deletion of Mpc1 abolished hepatic MPC activity and markedly decreased pyruvate-driven gluconeogenesis and TCA cycle flux. Loss of MPC activity induced adaptive utilization of glutamine and increased urea cycle activity. Diet-induced obesity increased hepatic MPC expression and activity. Constitutive Mpc1 deletion attenuated the development of hyperglycemia induced by a high-fat diet. Acute, virally mediated Mpc1 deletion after diet-induced obesity decreased hyperglycemia and improved glucose tolerance. We conclude that the MPC is required for efficient regulation of gluconeogenesis and that the MPC contributes to the elevated gluconeogenesis and hyperglycemia in T2D.


Figures

Figure 1
Figure 1. Generation and basic characterization of mice with liver-specific deletion of Mpc1
A: Western Blot analysis of Mpc1 and Mpc2 protein abundance in lysates of C57Bl/6J mouse tissues. Loading was normalized to total protein. A reference protein is not shown because of nonuniform expression among different tissues. B: Scheme illustrating generation of the Mpc1 null allele. C: Western blot analysis of Mpc1 and Mpc2 protein abundance in liver lysates from WT and Mpc1 LivKO mice. Loading was normalized to total protein and actin is utilized as a reference protein. D: Daily food intake by WT and Mpc1 LivKO mice, normalized to body weight (BW). (n=8) E: Voluntary physical activity, measured by beam breaks in CLAMS cages, of WT and Mpc1 LivKO mice. (n=8) F: Respiratory Exchange Ratio (RER) of WT and Mpc1 LivKO mice. (n=8) G,H: Glucose (G) and insulin (H) tolerance tests comparing WT and Mpc1 LivKO mice. Blood glucose was measured serially and an AUC calculated. (n=8) I: Glucose disposal rate (Rd) versus serum insulin during the basal and hyperinsulinemic sampling portions of the clamp. (n=5-6) J: Glucose appearance rate (Ra) versus serum insulin during the basal and hyperinsulinemic sampling portions of the clamp. (n=5-6) K: Insulin-stimulated uptake of 2-deoxyglucose during the terminal hyperinsulinemic portion of the clamp. (n=5-6) Data are presented as mean ± SEM (*p<0.05, **p<0.01). Also see Figure S1.
Figure 2
Figure 2. Effects of Mpc1 deletion on hepatic mitochondrial pyruvate metabolism
A: 14C-Pyruvate uptake by liver mitochondria isolated from WT and Mpc1 LivKO mice. (n=4) B: Pyruvate-driven (10 mM pyruvate/2 mM malate) respiration by liver mitochondria isolated from WT and Mpc1 LivKO mice. (n=4) C: Glutamate-driven (10 mM glutamate/2 mM malate) respiration by liver mitochondria isolated from WT and Mpc1 LivKO mice. (n=4) D: Western blot analysis of electron transport chain (ETC) components (Complex I-V), and Mpc1, Mpc2, VDAC, and HSP90 proteins in liver lysates from WT and Mpc1 LivKO mice. Densitometric quantification is relative to HSP90. Data are presented as mean ± SEM (**p<0.01). Also see Figure S2.
Figure 3
Figure 3. Lactate/pyruvate-driven gluconeogenesis is MPC-dependent
A: Lactate/pyruvate-driven gluconeogenesis by mouse primary hepatocytes isolated from WT and LivKO mice, in the presence of the MPC-inhibitor UK5099 (UK) or vehicle (Veh). (n=3) B,C: Blood (B) glucose excursion and (C) lactate clearance in WT and Mpc1 LivKO mice during a lactate/pyruvate tolerance test (L/PTT). Blood glucose and lactate were measured serially and AUCs calculated. (n=8) D: M+3 glucose concentrations in liver tissue from WT and Mpc1 LivKO mice following administration of U13C-labeled lactate/pyruvate. (n=6) Data are presented as mean ± SEM (*p<0.05, **p<0.01).
Figure 4
Figure 4. Glutaminolysis and pyruvate transformations enable MPC-independent gluconeogenesis
A: Ratios of absolute M+3 isotopomer concentrations in Mpc1 LivKO versus WT livers (LivKO/WT) following administration of U13C-labeled lactate/pyruvate. (n=5-6) B: Relative steady-state abundance of select metabolites in Mpc1 LivKO versus WT livers (LivKO/WT) after 18h fasting. (n=7-9) C: Glutamine-driven gluconeogenesis by mouse primary hepatocytes isolated from WT and Mpc1 LivKO mice, in the presence of the MPC-inhibitor UK5099 (UK) or vehicle (Veh). (n=3) D: Glutamine tolerance test (QTT) comparing WT and Mpc1 LivKO mice. Blood glucose was measured serially and an AUC calculated. (n=9) E: Gluconeogenesis by rat primary hepatocytes, supported by different substrates and treated with vehicle, the MPC inhibitor UK5099, the ALT-inhibitor β-Cl-A, or both. L/P: 4.5mM lactate/0.5mM pyruvate; L/P+Gln: 2.25mM lactate/0.25mM pyruvate + 2.5mM glutamine; L/P+Ala: 2.25mM lactate/0.25mM pyruvate + 2.5mM alanine; Gln: 5mM glutamine; Ala: 5mM alanine; and Mal: 5mM malate. (n=3) F: Model for pyruvate transformations to alanine and malate as MPC by-passes. Me1/2, malic enzyme (cytosolic/mitochondrial); Alt1/2, alanine transaminase (cytosolic/mitochondrial); Mdh1/2, malate dehydrogenase (cytosolic/mitochondrial); Pepck, phosphoenolpyruvate carboxykinase 1. Data are presented as mean ± SEM (p<0.05, **p<0.01, ***p<0.001). Also see Figure S3, Table S1, and Table S2.
Figure 5
Figure 5. Both constitutive and acute Mpc1 deletion attenuate hyperglycemia and glucose intolerance during high-fat diet induced obesity
A: Body weights of WT and Mpc1 LivKO mice over 12 weeks of high fat diet (HFD) feeding. (n=10) B,C: Postabsorptive blood (B) glucose and (C) insulin levels of WT and Mpc1 LivKO mice over 12 weeks of HFD. (n=10) D,E: Glucose (D) and insulin (E) tolerance tests comparing WT and Mpc1 LivKO mice after 12 weeks of HFD. Blood glucose was measured serially and an AUC calculated. (n=10) F: Schema illustrating the time-course of high fat feeding, tolerance test (TT) administration, and AAV-GFP/Cre administration for Mpc1fl/fl mice. G,H: Glucose (G) and insulin (H) tolerance tests comparing groups of HFD Mpc1fl/fl before treatment with either AAV-GFP or AAV-Cre. Blood glucose was measured serially and an AUC calculated. (n = 10) I,J: Glucose (I) and insulin (J) tolerance tests comparing groups of HFD Mpc1fl/fl mice after treatment with either AAV-GFP or AAV-Cre and hepatocyte-specific Mpc1 deletion in AAV-Cre treated mice. Blood glucose was measured serially and an AUC calculated. (n = 10) K: Blood glucose levels in AAV-GFP- and AAV-Cre-treated mice after 0, 4, 6, and 18 hours of fasting. (n=10) L: Serum insulin levels in AAV-GFP- and AAV-Cre-treated mice after 0, 6, and 18 of fasting. (n=5-10) Data are presented as mean ± SEM (*p<0.05, **p<0.01). Also see Figure S5.
Figure 6
Figure 6. Diet-induced obesity increases hepatic MPC protein levels and Activity
A: 14C-Pyruvate uptake by liver mitochondria isolated from high fat-diet fed versus age-matched normal chow fed control mice. (n=8) B,C: (B) Pyruvate-driven (10 mM pyruvate/2 mM malate) and (C) glutamate-driven (10 mM glutamate/2 mM malate) respiration by liver mitochondria isolated from high fat-diet fed versus age-matched normal chow-fed control mice (n=8). D: Relative Mpc1 and Mpc2 transcript abundance in livers of high fat-diet fed versus age-matched normal chow-fed control mice, normalized to U36b4. (n=8) E: Western blot analysis of electron transport chain (ETC) components (Complex I-V), and Mpc1, Mpc2, VDAC, and HSP90 proteins in liver lysates from high fat-diet fed versus age-matched normal chow-fed control mice. Densitometric quantification is relative to HSP90. (n=8) All mice were on a high-fat diet for 22 weeks from 6 weeks of age. Data are presented as mean ± SEM (*p<0.05, **p<0.01, ***p<0.001). Also see Figure S6.

Comment in

Similar articles

Cited by

References

    1. A J, Trygg J, Gullberg J, Johansson AI, Jonsson P, Antti H, Marklund SL, Moritz T. Extraction and GC/MS analysis of the human blood plasma metabolome. Anal Chem. 2005;77:8086–8094. - PubMed
    1. Bender T, Pena G, Martinou JC. Regulation of mitochondrial pyruvate uptake by alternative pyruvate carrier complexes. EMBO J. 2015 - PMC - PubMed
    1. Beuster G, Zarse K, Kaleta C, Thierbach R, Kiehntopf M, Steinberg P, Schuster S, Ristow M. Inhibition of alanine aminotransferase in silico and in vivo promotes mitochondrial metabolism to impair malignant growth. J Biol Chem. 2011;286:22323–22330. - PMC - PubMed
    1. Bricker DK, Taylor EB, Schell JC, Orsak T, Boutron A, Chen YC, Cox JE, Cardon CM, Van Vranken JG, Dephoure N, et al. A mitochondrial pyruvate carrier required for pyruvate uptake in yeast, Drosophila, and humans. Science. 2012;337:96–100. - PMC - PubMed
    1. Brivet M, Garcia-Cazorla A, Lyonnet S, Dumez Y, Nassogne MC, Slama A, Boutron A, Touati G, Legrand A, Saudubray JM. Impaired mitochondrial pyruvate importation in a patient and a fetus at risk. Mol Genet Metab. 2003;78:186–192. - PubMed

Publication types

MeSH terms

LinkOut - more resources