. 2015 Nov;58(5):511-7.
doi: 10.1016/j.ceca.2015.08.003. Epub 2015 Aug 20.

Picomolar sensitivity to inositol trisphosphate in Xenopus oocytes

Affiliations

Picomolar sensitivity to inositol trisphosphate in Xenopus oocytes

Angelo Demuro et al. Cell Calcium. 2015 Nov.

Abstract

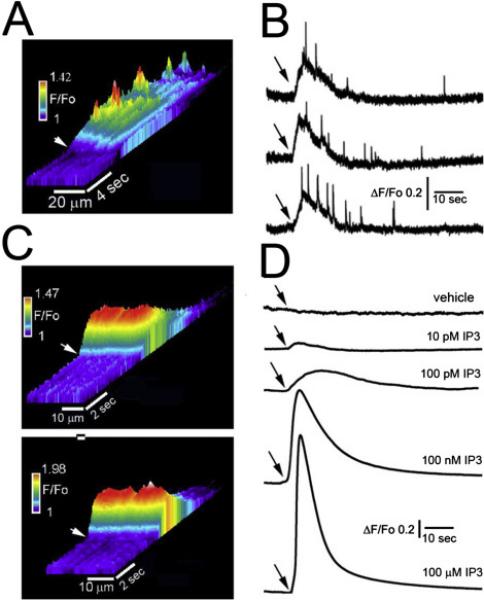
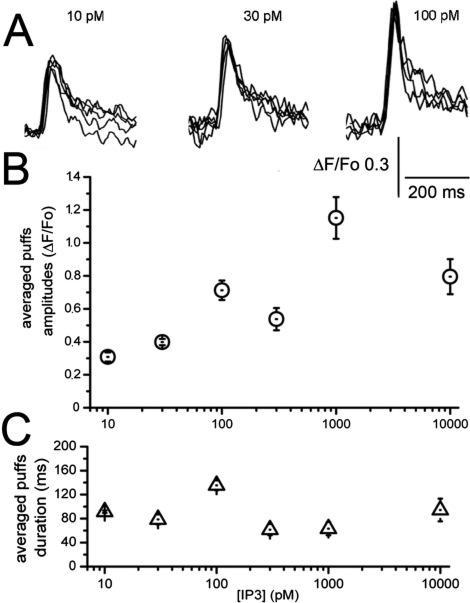
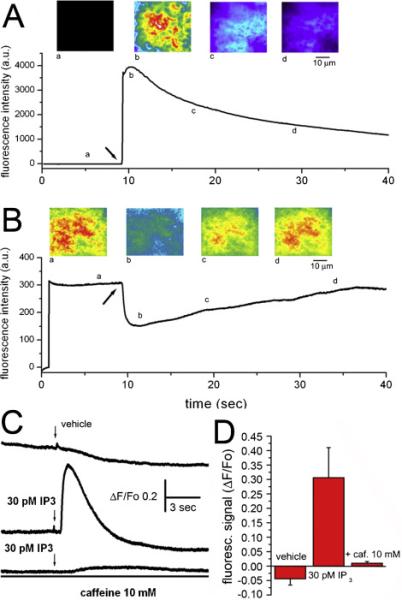
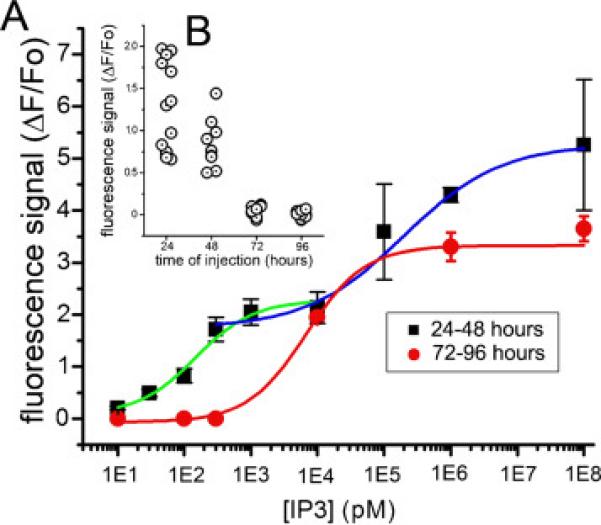
Ca(2+) liberation from the endoplasmic reticulum mediated by inositol trisphosphate receptor/channels (IP3Rs) in response to production of the second messenger IP3 regulates numerous signaling pathways. However, estimates of resting and physiologically relevant cytosolic concentrations of IP3 vary appreciably. Here we directly address this question, taking advantage of the large size of Xenopus oocytes to image Ca(2+) liberation evoked by bolus intracellular injections of known concentrations of IP3. Our principal finding is that IP3 evokes both global and local Ca(2+) signals in freshly isolated oocytes at concentrations as low as a few pM. A corollary is that basal, resting [IP3] must be even lower, given the absence of detectable Ca(2+) signals before injection. The dose/response curve for IP3-activation of Ca(2+) liberation suggests that freshly isolated oocytes express two distinct functional populations of IP3 receptors with EC50 values around 200 pM and tens of nM, whereas the high-affinity receptors are not apparent in oocytes examined later than about 3 days after isolation from the ovary.

Keywords: Calcium puffs; Calcium signaling; Inositol trisphosphate; Xenopus oocyte.


Figures

Fig. 1
Fig. 1
Ca2+ responses evoked by bolus injections of IP3 into Xenopus oocytes. (A) Linescan (kymograph) image illustrating spatio-temporal patterns of fluorescence Ca2+ signals evoked by intracellular injection of a 10 nl bolus of 10 pM IP3. The panel depicts fluorescence measured as a function of time along a line (40 μm long and 2 μm wide) on the video record. Increasing fluo-4 fluorescence (increasing free [Ca2+]) is represented by warmer colors as depicted by the color bar (scaled as F /F0) and by increasing height of each pixel. The arrow indicates the time of IP3 injection. (B) Representative traces showing fluorescence signals monitored from small (1 ×1 μm) regions of interest positioned sites of local activity (puff sites). (C) Corresponding linescan images recorded in response to injections of 10 nl of 100 pM (top) and 1 nM IP3 (bottom). (D) Traces show averaged fluorescence signals measured throughout the entire image field in response to injections of 10 nl of solutions of vehicle alone and containing different concentrations of IP3, as indicated.
Fig. 2
Fig. 2
Local Ca2+ puffs evoked by low concentrations of IP3. (A) Selected traces recorded in response to intracellular injections of 10 nl of solution containing 10, 30 and 100 pM IP3. Each panel shows 4-5 superimposed traces of fluorescence ratio signals from regions of interest (1 × 1 μm) centered on puff sites, with peaks aligned in time. (B) Scatterplot of mean peak puff amplitudes as a function of IP3 concentration. Error bars indicate ± 1 SEM (n = 7) C. Corresponding plot of mean puff durations (duration at half-maximal amplitude) as a function of [IP3].
Fig. 3
Fig. 3
(A) Estimating the spatio-temporal profile of injected [IP3] utilizing calcein as a fluorescent surrogate. The trace shows fluorescence averaged throughout a 20 × 20 μm region of interest centered on the pipette tip in response to injection of 10 nl of 1 μM calcein when marked by the arrow. The image panels show single frames captured at times as indicated on the trace. The fluorescence calibration bar and pseudocoloring of the images are in terms of arbitrary camera units. (B) Estimating the extent to which injected IP3 would be diluted by mixing with cytosolic fluid by injection of vehicle into an oocyte previously loaded with calcein (final cytosolic concentration about 1 μM). The trace shows fluorescence monitored from a 40 × 40 μm region around the pipette tip. Baseline fluorescence was recorded for about 9s after opening the laser shutter, and an injection of 10 nl of vehicle (without dye) was then made when marked by the arrow. The image panels show single frames captured at times as indicated on the trace. (C) Fluorescence signals evoked by IP3 injections arise from liberation of sequestered Ca2+ through IP3Rs. Traces in C illustrate representative responses to 10 nl injections of vehicle alone (top), 30 pM IP3 (middle), and 30 pM IP3 after pretreating the oocyte with 10 mM caffeine in the bathing solution (bottom). Bars in C show mean fluorescence changes (n = 11 oocytes each) evoked by 10 nl injections of vehicle alone (control); 30 pM IP3; and 30 pM IP3 in the presence of 10 mM caffeine in the bathing solution.
Fig. 4
Fig. 4
Dose/response relationship for IP3-evoked Ca2+ liberation and loss of sensitivity with time after oocyte isolation. (A) Dose-response relationships show mean peak fluorescence signals (averaged across the imaging field) evoked by injections of 10 nl of solutions containing concentrations of IP3 ranging from 10 pM to 100 μM. Data points represent mean ± 1 SEM from 4-8 oocytes. Data were grouped by the time between isolation of the oocytes and recording: black squares = 24-48 hr after isolation; red circles = 72-96 hr after isolation. Colored curves are sigmoidal relationships fitted to the data. Fits to the 24-48 hr data (black squares) were done independently for concentrations between 10 and 1000 pM (green curve) and between 1 nM and 100 μM (blue curve). (B) The inset scatter plot shows measurements of Ca2+ fluorescence signals evoked by injections of 10 nl of 30 pM IP3 into individual oocytes at different times after isolation from the ovary.

Similar articles

Cited by

References

    1. Berridge MJ. Inositol trisphosphate and calcium signalling. Nature. 1993;361:315–325. - PubMed
    1. Taylor CW, Genazzani AA, Morris SA. Expression of inositol trisphosphate receptors. Cell Calcium. 1999;26:237–251. - PubMed
    1. Foskett JK, White C, Cheung KH, Mak DO. Inositol trisphosphate receptor Ca2+ release channels. Physiol Rev. 2007;87:593–658. - PMC - PubMed
    1. Parker I, Miledi R. Injection of inositol 1,3,4,5-tetrakisphosphate into Xenopus oocytes generates a chloride current dependent upon intracellular calcium. Proc R Soc Lond B Biol Sci. 1987;232:59–70. - PubMed
    1. Demuro A, Parker I. Cytotoxicity of intracellular abeta42 amyloid oligomers involves Ca2+ release from the endoplasmic reticulum by stimulated production of inositol trisphosphate. J Neurosci. 2013;33:3824–3833. - PMC - PubMed

Publication types