. 2015 Sep 17;525(7569):339-44.
doi: 10.1038/nature14877. Epub 2015 Sep 7.

Panorama of ancient metazoan macromolecular complexes

Affiliations

Panorama of ancient metazoan macromolecular complexes

Cuihong Wan et al. Nature. .

Abstract

Macromolecular complexes are essential to conserved biological processes, but their prevalence across animals is unclear. By combining extensive biochemical fractionation with quantitative mass spectrometry, here we directly examined the composition of soluble multiprotein complexes among diverse metazoan models. Using an integrative approach, we generated a draft conservation map consisting of more than one million putative high-confidence co-complex interactions for species with fully sequenced genomes that encompasses functional modules present broadly across all extant animals. Clustering reveals a spectrum of conservation, ranging from ancient eukaryotic assemblies that have probably served cellular housekeeping roles for at least one billion years, ancestral complexes that have accrued contemporary components, and rarer metazoan innovations linked to multicellularity. We validated these projections by independent co-fractionation experiments in evolutionarily distant species, affinity purification and functional analyses. The comprehensiveness, centrality and modularity of these reconstructed interactomes reflect their fundamental mechanistic importance and adaptive value to animal cell systems.


Figures
Extended Data Figure 1
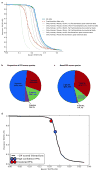
Extended Data Figure 1. Performance measures
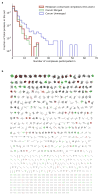
a, Performance benchmarks, measuring the precision and recall of our method and data in identifying known co-complex interactions from a withheld reference set of annotated human complexes (from CORUM; as in Fig. 2b). 5-fold cross-validation against this withheld set shows strong performance gains, beyond a baseline achieved using only human and mouse co-fractionation data along with additional evidence from independent protein interaction screens, and a functional gene network (far-left curve), made by integrating co-fractionation data from the additional non-human animal species (as indicated). “All data” and “Fractionation data only” curves include biochemical fractionation data from all 5 input species: human, mouse, urchin, fly and worm; the latter curve omits all external data. In all cases, at least 2 species were required to show supporting biochemical evidence. Recall is shown fraction of 4,528 total positive interactions derived from the withheld human CORUM complexes. b, All 16,655 interactions were identified at least in two species, half (49%, 8,121) found in three or more species. c, Among these high-confidence co-complex interactions, 8,981 (54%) were not reported in iRef (v13.0), Biogrid (v3.2.119) or CORUM reference (Supplementary Table 2) for any of the five input species or in yeast; half (46%, 4,128) of these novel co-complex interactions have co-fractionation evidences in 3 or more species. d, Final precision/recall performance on withheld interaction test set. An SVM classifier was trained using interactions derived from our training set of CORUM complexes, then ~1M protein pairs co-eluting in at least 2 of the 5 input species were scored by the classifier. Black curve shows precision and recall for ranked list of co-eluting pairs, with recall representing fraction recovered of 4,528 total positive interactions derived from the withheld set of merged human CORUM complexes, and precision measured using co-eluting pairs where both members of the pair are contained in the set of proteins represented in the CORUM withheld set. The top 16,655 pairs, giving a cumulative precision of 67.5% and recall of 23.0% on this withheld test set, form the high-confidence set of co-complex protein-protein interactions (blue circle). The highest-scoring interactions were clustered using the two-stage approach described in the Extended Methods, yielding a final set of 7,669 interactions which form the 981 identified complexes (red circle; precision=90.0%, recall=20.8%).
Extended Data Figure 2
Extended Data Figure 2. Properties of protein elution profiles
a, Distribution of global protein tissue expression pattern similarity, measured as the Pearson correlation coefficient of protein abundance across 30 human tissues, showing markedly higher correlations for 16,468 protein-protein pairs of putative co-complex interaction partners compared to the same number of randomized pairs of proteins in the network which were not predicted to interact. b, Heatmap illustrating the low to moderate cross-species Spearman’s rank correlation coefficients in the elution profiles observed between orthologous proteins during mixed-bed ion exchange chromatography (IEX-HPLC) under standardized conditions, highlighting the shift in absolute chromatographic retention times in different species. This variation indicates that the conservation of co-fractionation by putatively interacting proteins is not merely a trivial result stemming from fixed column retention times. c, The degree of co-fractionation is measured as the correlation coefficient between elution profiles. Spatial proximity is calculated from the mean of residue pair distances between components of multisubunit complexes with known 3D structures (see Extended Methods).
Extended Data Figure 3
Extended Data Figure 3. Derivation of complexes
a, The 2,153 proteins present in the 981 derived metazoan complexes participate in multiple assemblies (‘moonlighting’) to an extent comparable to the sharing of subunits reported for literature-derived complexes (CORUM). For comparison, we examined the 1,550 unique proteins from the full CORUM set of 1,216 human complexes passing our selection criteria for supporting evidence (‘Unmerged’) and the 1,461 unique proteins from the non-redundant set of 501 merged complexes used as the reference for splitting our training and testing sets, with some of the largest complexes removed to avoid bias in training (‘Merged’; see ‘Optimizing the two-stage clustering’ in Extended Methods for details). b, Schematic of 981 identified complexes containing 2,153 unique proteins. In this graphical representation, 7,669 co-complex interactions are shown as lines, and proteins as nodes. Red and green interactions were previously annotated in CORUM. Red interactions were used in training the classifier and/or clustering procedure, while green interactions were held out for validation purposes. Gray interactions were not previously annotated in CORUM.
Extended Data Figure 4
Extended Data Figure 4. Properties of new and old proteins and complexes
a, The 2,153 protein components in the conserved animal complexes tend to be more ancient than the 2,301 proteins reported in the CORUM reference complexes or in two recent large-scale protein interaction assays, based on either the 7,062 proteins found by affinity purification/mass spectrometry (AP/MS; BioGrid 166968, Huttlin EL (2014/pre-pub), downloaded Feb 10th 2015) or the 3,667 proteins analyzed by yeast two-hybrid assays (Y2H). Ages are derived from OMA as in ref. . b, Annotation rates (mean count of annotation terms per protein) of old and new proteins in the derived complexes and pairwise PPI, compared with proteins in the CORUM reference complex set. Old proteins (defined by OMA) from the complexes generally exhibited higher annotation rates than new proteins. c, Differential enrichment of old, mixed and metazoan-specific protein complexes for functional annotations (select GO-slim biological process terms shown, top) and protein domains (Pfam, bottom).
Extended Data Figure 5
Extended Data Figure 5. Abundance and expression trends for proteins in complexes
Proteins within the identified complexes tend to be ubiquitously expressed across human tissues. Pie charts show the proportions of proteins with varying tissue expression patterns, from a recently published human tissue proteome map, comparing: a, the full set of 20,258 human proteins, with b, the 2,131 proteins within the identified complexes. Consistent with these observations, 91% of the protein components in the complexes were expressed in >15 tissues in data from a reference human proteome, compared to less than half (46%) of the 17,294 proteins in the overall reference set (Z-test p < 0.001). The distributions of average mRNA and protein abundances for all proteins identified and those within complexes are shown in panel c, mRNA abundances (data from EBI accession E-MTAB-1733) and d, protein abundances (data from PaxDb integrated dataset, 9606-H.sapiens_whole_organism-integrated_dataset). Evolutionarily ‘old’ proteins (defined by OMA as described in ref. and mentioned earlier) tend towards higher abundances, even for proteins in reference complexes.
Extended Data Figure 6
Extended Data Figure 6. Additional validation data
a, Confirmation of MIB2 interactions by co-immunoprecipitation. Extract (~10 mg protein) from cultured human HCT116 cells expressing FLAG-tagged MIB2 or control (WT) cells was incubated with 100 μl anti-FLAG M2 resin for 4 h by gently rotating at 4°C. After extensive washing with RIPA buffer, co-purifying proteins bound to the beads were eluted by the addition of 25 μl Laemmli loading buffer at 95 °C. Polypeptides were separated by SDS-PAGE and immunoblotted using FLAG, VPS4A, VPS4B or IST1 antibodies as indicated (expanded gel images provided in SI). b, Protein co-complex interactions reported in the CYC2008 yeast protein complex database are reconstructed accurately from the co-fractionation data, regardless of whether the full set of co-fractionation plus external data are used to derive protein interactions (‘All data’, see also Fig. 4b) or if the external yeast data was specifically excluded from the analyses (‘All data, excluding yeast’).
Extended Data Figure 7
Extended Data Figure 7. Agreement of derived complexes’ molecular weights with measurement by HPLC and density centrifugation
a, CORUM reference complexes’ inferred molecular weights (MW) are consistent with their components’ average cumulative size exclusion chromatograms. The molecular weights of each complex was calculated as the sum of putative component molecular weights, assuming 1:1 stoichiometry. Data from ref. were analyzed as in Fig. 4c and show a similar trend as for the derived complexes. b, Derived complexes’ inferred molecular weights (MW) are broadly consistent with their components’ average cumulative ultracentrifugation profiles on a sucrose density gradient. Average profiles are plotted for X. laevis orthologs, based on a preparation of hemoglobin-depleted heart and liver proteins separated on a 7 – 47% sucrose density gradient, as described in the Extended Methods.
Extended Data Figure 8
Extended Data Figure 8. Distribution of uncharacterized proteins and novel interactions across the 981 derived complexes
Complexes were sorted by median age (defined by OMA). Among 2,153 unique proteins, 293 (red) lack Gene Ontology (GO) functional annotations, while 1,756 of 7,665 co-complex interactions are novel (light green) (i.e., not listed in iRef curation database).
Extended Data Figure 9
Extended Data Figure 9. Properties of the Commander complex
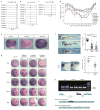
The automatically-derived 8 subunit Commander complex (Fig. 3b) was subsequently extended to 13 subunits (COMMD1 to 10, CCDC22, CCDC93, and SH3GLB1) based on combined analysis of AP-MS (Fig. 4a), size exclusion chromatograms (Fig. 4d), published pairwise interactions,,, and analysis of elution profiles of the remaining COMM domain containing proteins, as shown here. Example protein elution profiles are plotted for Commander complex subunits observed from: a, HEK293 cell nuclear extract; b, sea urchin embryonic (5 days post-fertilization) extract; and c, fly SL2 cell nuclear extract; each fractionated by heparin affinity chromatography. d, Co-expression of Commander complex subunits during embryonic development of X. tropicalis (plotting mean +/− s.d. of 3 clutches; data from ref. ). e, mRNA expression patterns of Commander complex subunits in stage 15 X. laevis embryos. Images show coordinated spatial expression in early vertebrate embryogenesis, as measured by in situ hybridization (3 embryos examined). f, Knockdown of Commd2 induced marked head and eye defects in developing X. laevis. (top) Commd2 antisense knockdown significantly decreased eye size, shown for stage 38 tadpoles (from 3 clutches; control n = 47 animals, 1 eye each); phenotypes were consistent between translation blocking (MOatg; n = 60) morpholino reagents, splice site blocking (MOsp; n = 50) morpholinos, and knockdowns of interaction partner Commd3 (see Fig. 5a). ***, p < 0.0001, 2-sided Mann-Whitney test. (bottom) Commd2 knockdown induced altered Pax6 patterning in the embryonic eye (control n = 8 animals, 2 eyes each; MO n = 11). g, Commd2/3 knockdown animals show altered neural patterning. Changes in stage 15 X. laevis embryos, measured by in situ hybridization (assayed in duplicates; 5 embryos per treatment), seen upon knockdown but not on controls: the forebrain marker PAX6 was expanded, while the mid-brain marker EN2 was strongly reduced. Strikingly, while expression of KROX20/EGR1 in rhombomere R3 was shifted posteriorly, expression in R5 was strongly reduced or entirely absent. Panels in Fig. 5b are reproduced from this figure and are directly comparable. h, Confirmation of splice-blocking Commd2 morpholino activity. Images and schematic show the basis and results of RT-PCR and agarose gel electrophoresis obtained with the corresponding X. laevis knockdown tadpoles.
Extended Data Figure 10
Extended Data Figure 10. Supporting data for BUB3 and CCDC97 experiments
a, Sequence alignment showing conservation of ZNF207 GLEBS domain. b, Targeted CRISPR/Cas9 induced knockout of CCDC97 in two independent lines of human HEK293 cells, as verified by Western blotting (expanded gel images provided in SI), also results in a slight decrease in annotated SF3B3 component levels. c, Loss of CCDC97 impairs cell growth. Lines show growth curves of control versus knockout cell lines in two biological replicate assays.
Figure 1
Figure 1. Workflow
a, Phylogenetic relationships of organisms analyzed in this study. We fractionated soluble protein complexes from worm (C. elegans) larvae, fly (D. melanogaster) S2 cells, mouse (M. musculus) embryonic stem cells, sea urchin (S. purpuratus) eggs, and human (HEK293/HeLa) cell lines. Holdout species (‘T’, for test) likewise analyzed were frog (X. laevis), an amphibian; sea anemone (N. vectensis), a Cnidarian with primitive Eumetazoan tissue organization; slime mold (D. discoideum), an amoeba; and yeast (S. cerevisiae), a unicellular eukaryote. b, Protein fractions were digested and analysed by high performance liquid chromatography-tandem mass spectrometry (LC-MS/MS), measuring peptide spectral counts and precursor ion intensities. c. Integrative computational analysis: after ortholog mapping to human, correlation scores of co-eluting protein pairs detected in each ‘input’ species were subjected to machine learning together with additional external association evidence, using the CORUM complex database as a reference standard for training. High-confidence interactions were clustered to define co-complex membership.
Figure 2
Figure 2. Derivation and projection of protein co-complex associations across taxa
a, Expanded coverage via experimental scale-up relative to our previous human study. Chart shows number of proteins detected, most (63%) in two or more species. b, Performance benchmarks, measuring precision and recall of our method and data in identifying known co-complex interactions (annotated human complexes from CORUM). Complexes were split into training and withheld test sets; 5-fold cross-validation against 4,528 interactions derived from the withheld test set shows strong performance gains, beyond baselines achieved using only co-fractionation or external evidence alone. c, Plots showing high enrichment (probability ratio of interacting) of predicted interacting orthologous protein pairs (relative to non-interacting pairs) among highly correlated fractionation profiles, in both the holdout validation (test, ‘T’) and input species (colors reflect clade memberships). d, (left) Representative co-fractionation data (normalized spectral counts shown for portions of 3 of 42 experimental profiles) from human, fly, and sea urchin showing characteristic profiles of proteasome core, base and lid subcomplexes. Hierarchical clustering (right) of pan-species pairwise Pearson correlation scores (centre) is consistent with accepted structural models (PDB id: 4CR2; core, red; base, blue; lid, green; out-clusters, white). e, Projection of conserved co-complex interactions across 122 eukaryotic species, indicating overlap with leading public PPI reference databases. STRING bars indicate excess over CORUM; GeneMania bars indicate excess over both; component and interaction occurences across Clades indicated at bottom.
Figure 3
Figure 3. Prevalence of conservation of protein complexes across metazoa and beyond
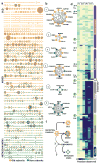
a, Conserved multiprotein complexes, identified by clustering, arranged according to average estimated component age (see Extended Methods and ref. ). Proteins (nodes) classified as metazoan (green) or ancient (orange); assemblies showing divergent phylogenetic trajectories termed ‘mixed’. b, Example complexes with different proportions of old and new subunits. c, Presumed origins of metazoan (new), mixed, and old complexes; ‘?’ indicates variable origins of new genes. d, Heatmap showing prevalence of selected complexes across phyla. Color reflects fraction of components with detectable orthologs (absence, dark blue). Sea anemone (N. vectensis) most distant metazoan (Cnidarian) analyzed biochemically.
Figure 4
Figure 4. Physical validation of complexes
a, Verification of complexes from tagged human cell lines and transgenic worms (see Extended Methods). Inset reports spectral counts obtained in replicate AP/MS analyses of indicated bait protein (header). MIB2-VPS4 complex confirmed by co-IP (Extended Data Fig. 6a). b, Conserved complexes significantly overlap large-scale AP/MS data reported for human cell lines (BioGrid pre-pub 166968, Huttlin et al., 2015) to a comparable extent as literature reference sets,, using 3 measures of complex-level agreement (see Extended Methods, Extended Data Fig. 6b); ***, p-value < 0.001, determined by shuffling (gray distributions). c, Agreement of inferred molecular weights (MW) of human protein complexes with size exclusion chromatography (SEC) profiles (data in c, d from ref. ). d, Co-elution of human Commander complex subunits by SEC consistent with an approx. 500 kDa particle.
Figure 5
Figure 5. Functional validation of complexes
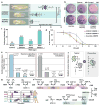
a, Morpholino knockdown of COMMD2 (n = 55 animals, 2 clutches, 1 eye each) or COMMD3 (n = 64) in X. laevis embryos causes defective head and eye development (control n = 57; Extended Data Fig. 9f, h). ***, p < 0.0001, 2-sided Mann-Whitney test. b, COMMD2/3 knockdown animals (5 embryos per treatment examined) show altered neural patterning, including posterior shift or loss of expression of mid-brain marker EN2 and KROX20(EGR1), the latter in rhombomeres R3/R5 (compare to Extended Data Fig. 9g, h). c, Enhanced embryonic lethality (i.e., epistasis) following RNAi knockdown in C. elegans of B0035.1 (ZNF207) and bub-3 together (eggs laid: HT115, 1308; B0035.1, 1096; bub-3, 445; bub-3 + B0035.1, 341). d, Enhanced sensitivity (mean +/− s.d. across four cell culture experiments) of two independent CCDC97-knockout lines to the SF3b inhibitor pladienolide B (PB) relative to control HEK293 cells. e, Enrichment (permutation test p-value) for interactions among sequential pathway components and metabolic enzymes relative to shuffled controls (n refers to enzyme index, where n,n+1 denotes sequential enzymes, n,n+2 sequential-but-one, etc, as described in SI (“Analysis of consecutively acting signal transduction and metabolic enzyme interactions”). f, Metabolic channeling as opposed to traditional (typical) two-step cascade model. g, Conserved interactions among consecutively acting enzymes involved in purine biosynthesis (2 representative co-fractionation profiles of the 69 total generated are shown).

Comment in

References

    1. Hartwell LH, Hopfield JJ, Leibler S, Murray AW. From molecular to modular cell biology. Nature. 1999;402:C47–C52. doi: 10.1038/35011540. - DOI - PubMed
    1. Alberts B. The cell as a collection of protein machines: Preparing the next generation of molecular biologists. Cell. 1998;92:291–294. doi: 10.1016/s0092-8674(00)80922-8. - DOI - PubMed
    1. Butland G, et al. Interaction network containing conserved and essential protein complexes in Escherichia coli. Nature. 2005;433:531–537. - PubMed
    1. Krogan NJ, et al. Global landscape of protein complexes in the yeast Saccharomyces cerevisiae. Nature. 2006;440:637–643. - PubMed
    1. Guruharsha KG, et al. A Protein Complex Network of Drosophila melanogaster. Cell. 2011;147:690–703. - PMC - PubMed

Publication types

Substances