. 2015 Oct 8;526(7572):224-9.
doi: 10.1038/nature14853. Epub 2015 Sep 7.

Glycine receptor mechanism elucidated by electron cryo-microscopy

Affiliations

Glycine receptor mechanism elucidated by electron cryo-microscopy

Juan Du et al. Nature. .

Abstract

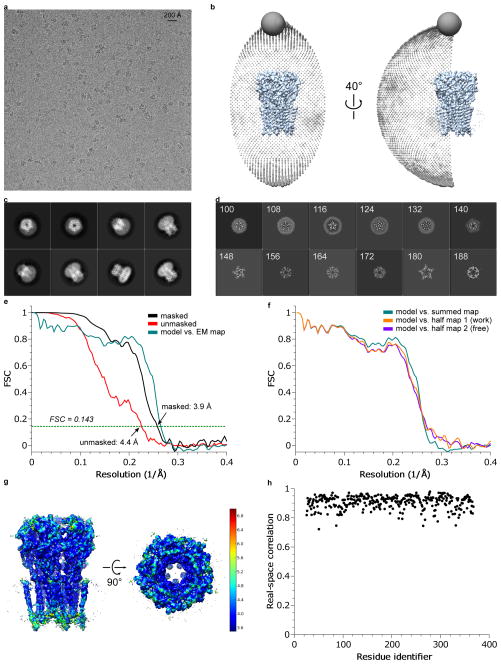
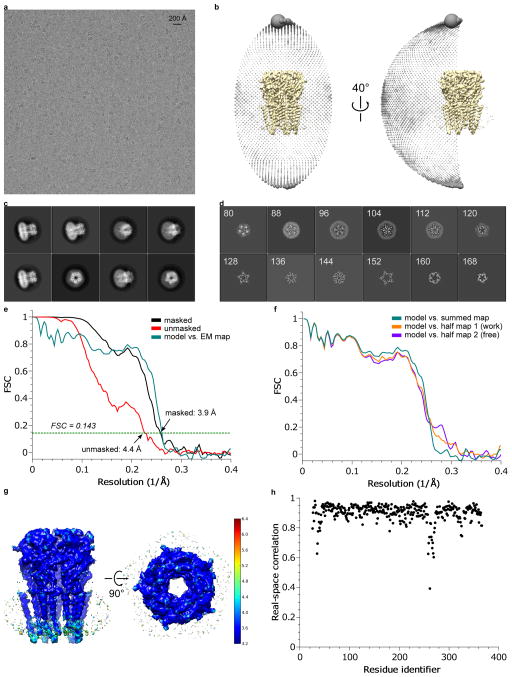
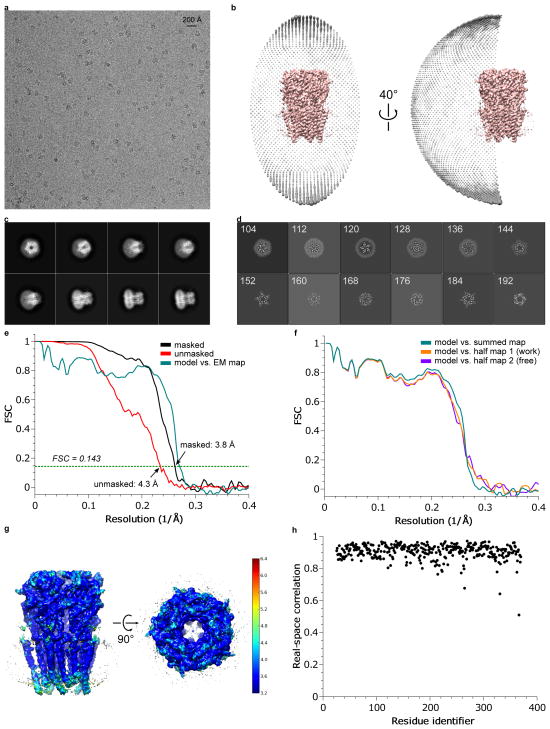
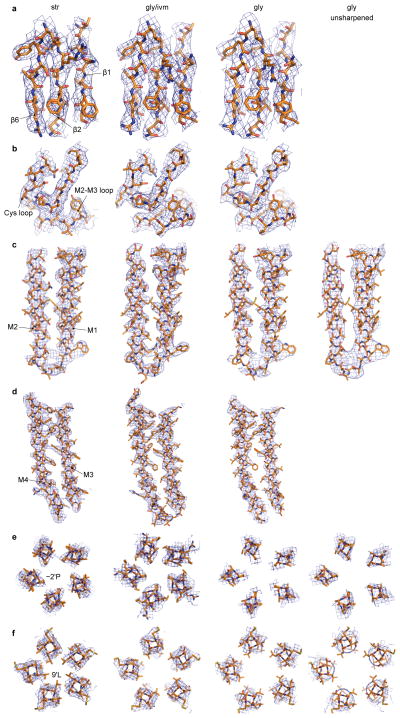
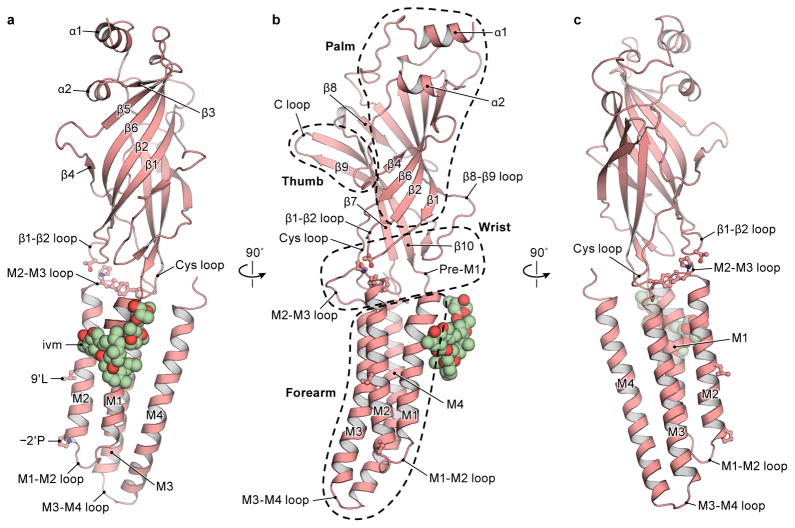
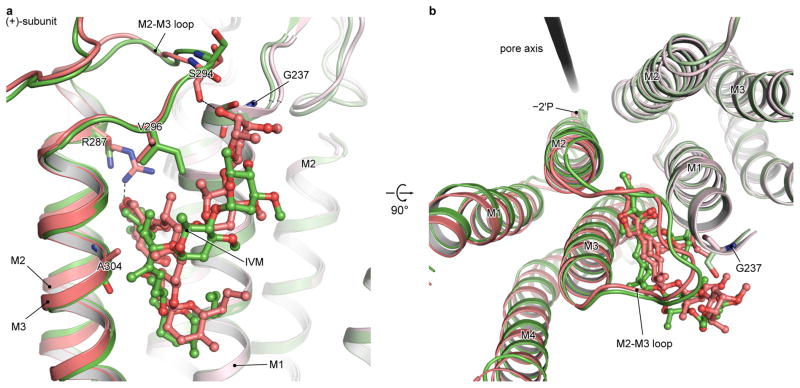
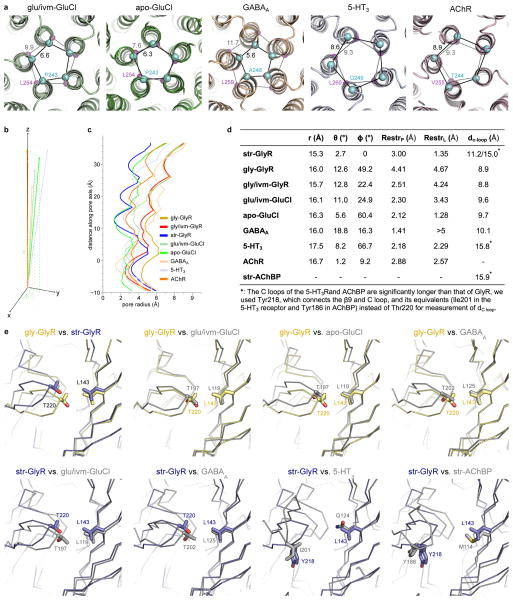
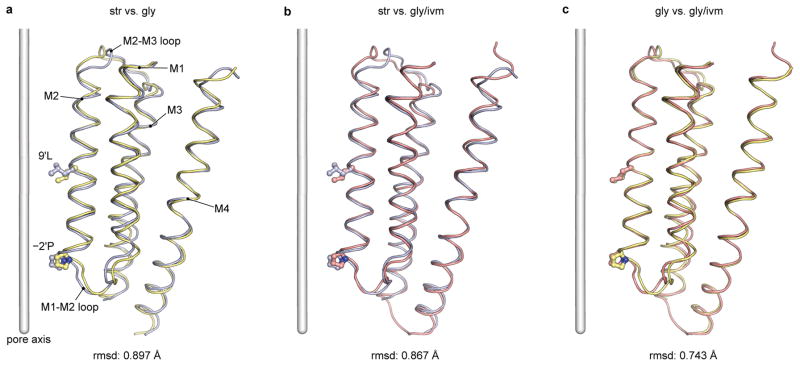
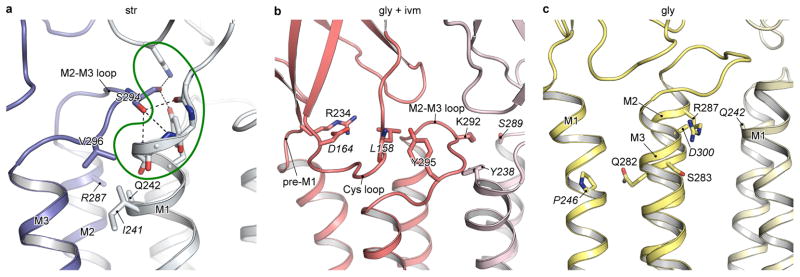
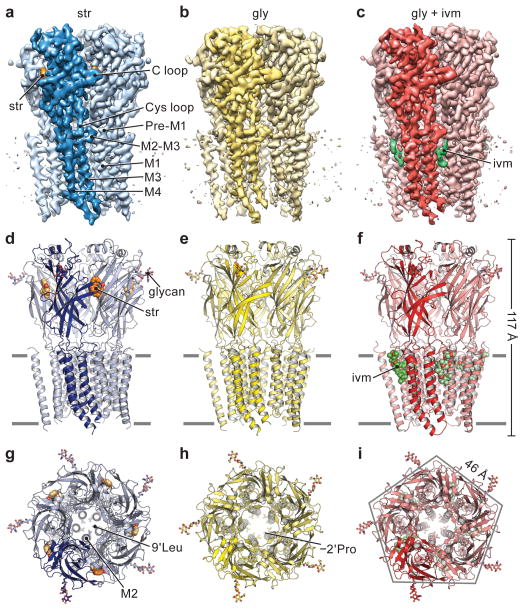
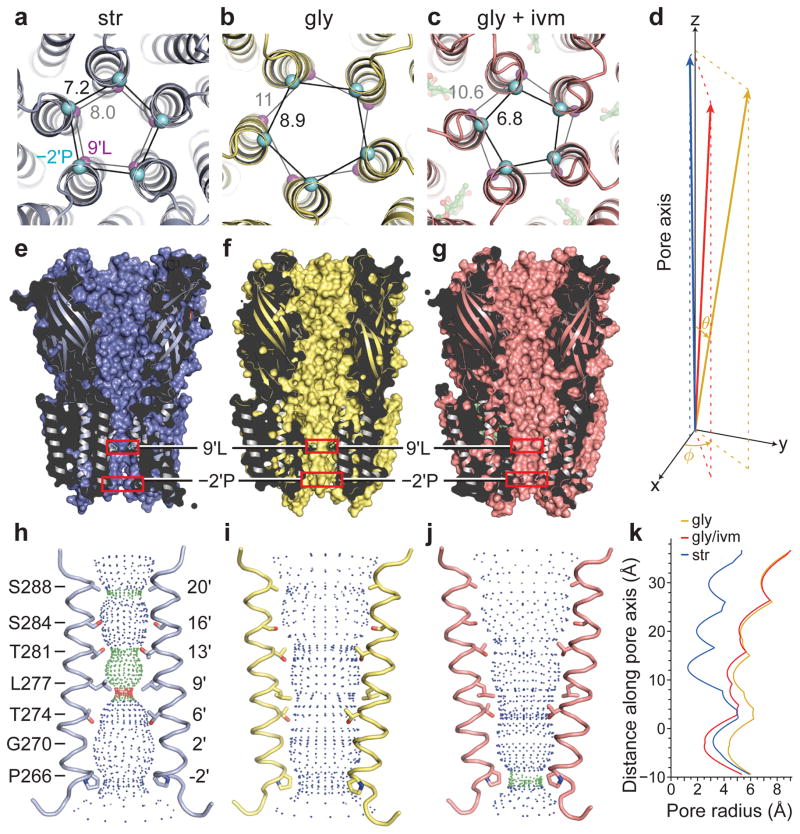
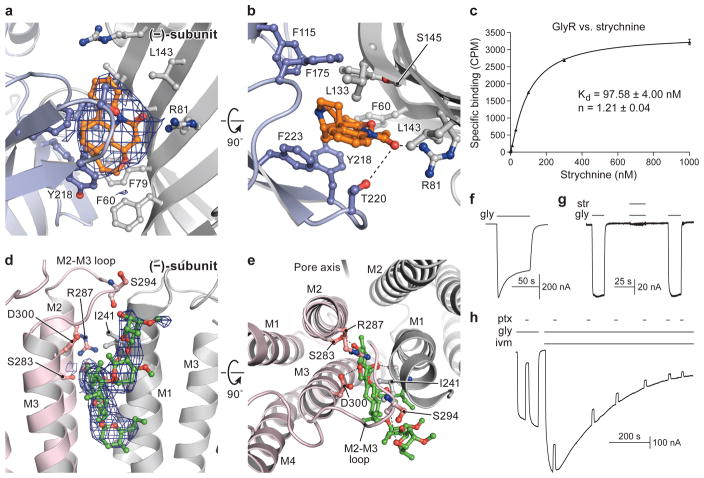
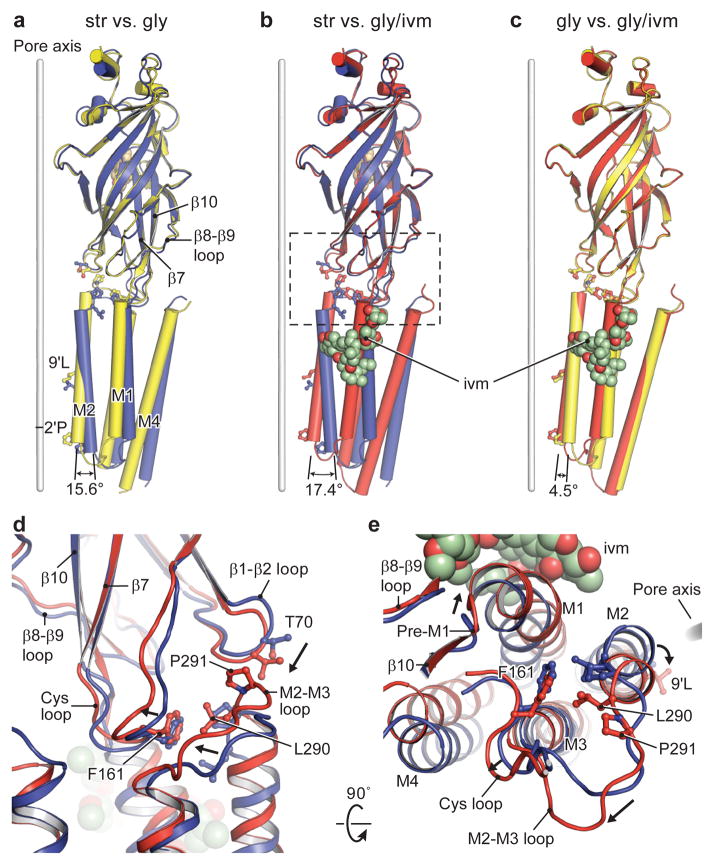
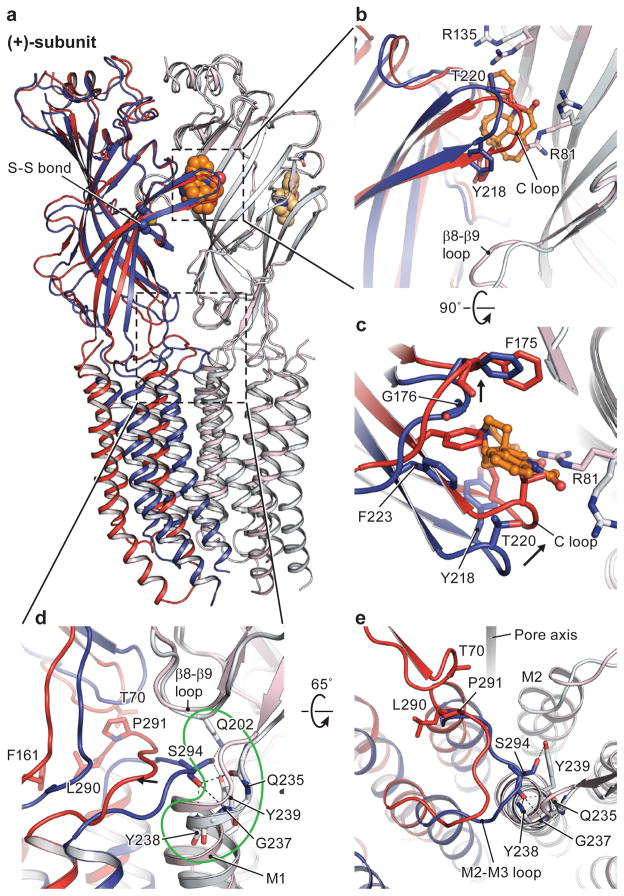
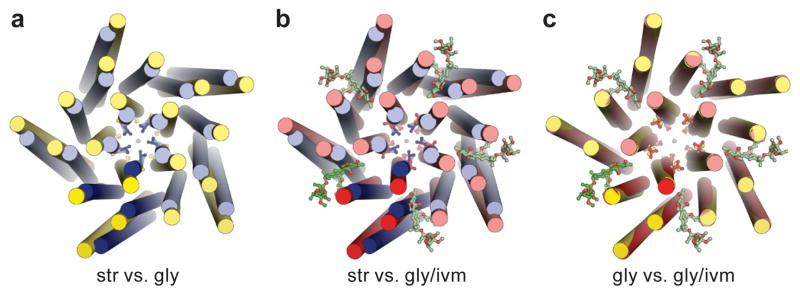
The strychnine-sensitive glycine receptor (GlyR) mediates inhibitory synaptic transmission in the spinal cord and brainstem and is linked to neurological disorders, including autism and hyperekplexia. Understanding of molecular mechanisms and pharmacology of glycine receptors has been hindered by a lack of high-resolution structures. Here we report electron cryo-microscopy structures of the zebrafish α1 GlyR with strychnine, glycine, or glycine and ivermectin (glycine/ivermectin). Strychnine arrests the receptor in an antagonist-bound closed ion channel state, glycine stabilizes the receptor in an agonist-bound open channel state, and the glycine/ivermectin complex adopts a potentially desensitized or partially open state. Relative to the glycine-bound state, strychnine expands the agonist-binding pocket via outward movement of the C loop, promotes rearrangement of the extracellular and transmembrane domain 'wrist' interface, and leads to rotation of the transmembrane domain towards the pore axis, occluding the ion conduction pathway. These structures illuminate the GlyR mechanism and define a rubric to interpret structures of Cys-loop receptors.


Conflict of interest statement

The authors declare no competing financial interests.

Figures

Extended Data Figure 1
Extended Data Figure 1. 3D reconstruction of strychnine-bound GlyR
a, A representative micrograph (out of 1829 micrographs) of str-bound GlyR in vitreous ice. b, Angular distribution of particle projections, and c, selected 2D classes are shown. In panel (c), the radius of the sphere is proportional to the number of particles assigned to it. The plot is drawn with respect to the 3D reconstruction shown in the center, taking the C5 symmetry of the receptor into account. d, Selected ‘slice’ views of the final reconstruction along the pore axis. The slice numbers are indicated, starting from the intracellular side. e, FSC curves for the density maps before (red) and after postprocessing in RELION (black). The FSC curve between the refined atomic model and the final reconstruction map is shown in green. f, FSC curves for cross-validation: model versus summed map (full data set, green), model versus half map 1 (used in test refinement, orange) and model versus half map 2 (not used in test refinement, blue). g, Unfiltered and unsharpened 3D density map colored according to local resolution estimated using RESMAP. h, Real-space correlation between atomic model and density map calculated using PHENIX.
Extended Data Figure 2
Extended Data Figure 2. 3D reconstruction of glycine-bound GlyR
a, A representative micrograph (out of 1460 migrographs) of gly-bound GlyR in vitreous ice. b, Angular distribution of particle projections, and c, selected 2D classes are shown. In panel (c), the radius of the sphere is proportional to the number of particles assigned to it. The plot is drawn with respect to the 3D reconstruction shown in the center, taking the C5 symmetry of the receptor into account. d, Selected ‘slice’ views of the final reconstruction along the pore axis. The slice numbers are indicated, starting from the intracellular side. e, FSC curves for the density maps before (red) and after (black) post-processing in RELION. The FSC curve between the refined atomic model and the final reconstruction map is shown in green. f, FSC curves for cross-validation: model versus summed map (full data set, green), model versus half map 1 (used in test refinement, orange) and model versus half map 2 (not used in test refinement, blue). g, Unfiltered and unsharpened 3D density map colored according to local resolution estimated using RESMAP. h, Real-space correlation between atomic model and density map calculated using PHENIX.
Extended Data Figure 3
Extended Data Figure 3. 3D reconstruction of glycine/ivermectin bound GlyR
a, A representative micrograph (out of 2489 micrographs) of gly/ivm-bound GlyR in vitreous ice. b, Angular distribution of particle projections, and c, selected 2D classes are shown. In panel (c), the radius of the sphere is proportional to the number of particles assigned to it. The plot is drawn with respect to the 3D reconstruction shown in the center, taking the C5 symmetry of the receptor into account. d, Selected ‘slice’ views of the final reconstruction along the pore axis. The slice numbers are indicated, starting from the intracellular side. e, FSC curves for the density maps before (red) and after (black) post-processing in RELION. The FSC curve between the refined atomic model and the final reconstruction map is shown in green. f, FSC curves for cross-validation: model versus summed map (full data set, green), model versus half map 1 (used in test refinement, orange) and model versus half map 2 (not used in test refinement, blue). g, Unfiltered and unsharpened 3D density map colored according to local resolution estimated using RESMAP. h, Real-space correlation between atomic model and density map calculated using PHENIX.
Extended Data Figure 4
Extended Data Figure 4. Representative densities of the three reconstructions of GlyR. Densities are sharpened using RELION unless indicated
The densities in each panel are for the str-, gly/ivm-, gly-, and unsharpened gly-bound states, respectively, from left to right. a, Representative densities of the β-sheets in ECD, contoured at 8 σ. b, Densities of Cys-loop and the M2-M3 loop, contoured at 7 σ. c, Densities of helices M1 and M2, contoured at 7 σ. d, Densities of M3 and M4, contoured at 7 σ. e, Densities of −2′Pro, contoured at 7 σ except for the gly-bound state (6.5 σ). f, Densities of 9′Leu, contoured at 6.0 σ except for the gly-bound state (5.0 σ).
Extended Data Figure 5
a–c, A single subunit of glycine/ivermectin bound GlyR, viewed in parallel to the membrane plane, with secondary structure elements labeled. b, the domain arrangement resembles an upright forearm, clad with a mitten, consisting of thumb (C loop), palm (β strands of ECD) and ligament (ECD-TMD interface).
Extended Data Figure 6
Extended Data Figure 6. Comparison of ivermectin binding site in GlyR (red) and GluCl (green), viewed in parallel to the membrane (a) or from the extracellular side (b)
The (+)subunits are shown in darker colors. The residue corresponding to Arg287, which forms a hydrogen bond with the ivmermectin in GlyR, is an asparagine (Asn264) in GluCl. The corresponding residue of Val296 in the M2-M3 loop of GlyR is an isoleucine (Ile273) in GluCl, whose larger side chain prevents the upper tip of ivermectin from approaching and interacting with the main chain oxygen atom of Ser721 in the M2-M3 loop (Ser294 in GlyR). The Gly237 in the M1 and Ala304 in the M3 of GlyR are Ser217 and Gly281 in GluCl, respectively. Such differences on side chains weaken or strengthen the interaction of ivermectin with M3 or M1 in GlyR, respectively, in comparison to that in GluCl.
Extended Data Figure 7
Extended Data Figure 7. Comparison of GlyR with other Cys-loop receptors
a, The two restriction sites, viewed from the cytoplasmic side. The Cα of −2′Pro equivalents (cyan) and 9′Leu equivalents (magenta) are shown as spheres. Distances between adjacent Cα atoms are labeled. b, Plot of the vector connecting the −2′ProCα equivalent and 9′LeuCα equivalent, with −2ProCα equivalent as the origin, the tilt angle θ and the rotation angle φ relative to the pore axis. The φ of str-bound GlyR is arbitrarily set to zero. c, Pore radii as a function of distance along the pore axis, calculated using the program HOLE, where the Cα position of 0′Arg is set to zero. d, Table showing parameters of the vector connecting the −2′ProCα equivalent and 9′LeuCα equivalent, where r is the distance from −2′ProCα equivalent to 9′LeuCα equivalent, RestrP and RestrL are the pore radii at −2′Pro equivalent and 9′Leu equivalent, respectively. The dC loop is the distance between Cα of Thr220 equivalent and Leu143 equivalent, representing the opening of the C loop shown in panel (e). e, Comparison of ligand binding pockets. The side chains of marker residues are shown in sticks.
Extended Data Figure 8
Extended Data Figure 8. Superimposition of TMD between str- and gly-GlyR (a), str- and gly/ivm-GlyR (b), gly- and gly/ivm-GlyR (c) using main chain atoms of residues Met236-Lys362
The M2-M3 loop, residues Ser289-Ala298, is excluded from the comparison. The r.m.s.d. are 0.9, 0.9 and 0.7 A, respectively, suggesting that the movement of the TMD is rigid-body-like. Most differences are located in the termini of transmembrane helices, which are either close to the M2-M3 loop, or close to the intracellular gate −2′Pro.
Extended Data Figure 9
Extended Data Figure 9. Positions of residues whose mutations are associated with human startle disease
Residues that likely interact with disease-causing residues are labeled in italics. a, The str-GlyR model is used to show residues whose mutations cause spontaneous activation. The mutation of Gln242 in M1 to glutamate may enhance its electrostatic attraction to Arg287 in M2 of the adjacent subunit, tilt the upper part of M2 away from pore axis, resulting in a constitutively open channel. On the other hand, the mutation Val296Met in M2-M3 loop may cause steric collision with Ile241 in M1 of the adjacent subunit, and prevent Ser294 from interacting to the N-cap formed by pre-M1, M1 and the β8-β9 loop, thereby destabilizing the closed conformation. b, The gly/ivm-GlyR model is used to show residues in the ECD-TMD interface whose mutations reduce sensitivity to glycine and single channel conductance. The mutation of Arg234 in pre-M1 to glutamine may disturb its electrostatic interaction with Asp164 in the Cys-loop. Similarly, the mutation of Tyr295 in the M2-M3 loop to cysteine or serine may disturb its interaction with the main chain nitrogen atom of Leu158 in the Cys-loop. In both cases, the signal induced by agonist binding may be blocked. The mutation Lys292Glu in the M2-M3 loop possibly affects the cooperative interaction between two adjacent subunits by altering the van der Waals contacts between Lys292 and Tyr238. c, The gly-GlyR model is used to show residues in M2 whose mutations reduce sensitivity to glycine and diminish single channel conductance. These mutations may directly influence the pore properties by modifying the interactions with adjacent residues, for instance, between Gln282His and Pro246, and between Arg287Gln/Leu and Gln242.
Figure 1
Figure 1. Receptor architecture
a–c, The 3D reconstruction maps, viewed parallel to the membrane (str-bound in blue, gly-bound in yellow and gly/ivm-bound in red). One subunit is highlighted. The densities for strychnine and ivermectin are orange and green, respectively. d–f, Cartoon representations of the corresponding models of reconstructions shown in ac, viewed in parallel to the membrane plane. The Asn-linked carbohydrate and associated Asn54 residue are in stick representation. g–i, Views of the structures from the extracellular side of the membrane. Residues −2′Pro (Pro266) and 9′Leu (Leu277) reside on the pore-lining M2 helix.
Figure 2
Figure 2. The ion channel
a–c, Two sites of pore constriction are at −2′Pro and 9′Leu, viewed from the cytoplasmic side, with their Cα in cyan and magenta spheres, respectively. Distances are in Ångstrom. d, Plot of the pore-lining M2 as represented by the vector connecting −2′ProCα and 9′LeuCα, with −2ProCα as the origin, the tilt angle θ and the rotation angle φ relative to the pore axis. The φ of str-bound GlyR is set to zero. e–g, Sagittal ‘slice’ views along the pore axis. h–j, Shape and size of the ion permeation pathway. M2 of two subunits are shown as ribbon representation, where the side chains of the pore-lining residues are shown in sticks. Blue, green and red spheres define radii of >3.3Å, 1.8–3.3 Å and <1.8 Å, respectively. k, Plot of pore radii as a function of distance along the pore axis. The Cα position of 0′Arg is set to zero.
Figure 3
Figure 3. Strychnine and ivermectin bind at subunit interfaces
Strychnine binding site (+; light blue) (−; gray); view is parallel to the membrane (a) or from the extracellular side (b). Density for strychnine (blue mesh) is contoured at 7 σ. c, Saturation binding of 3H strychnine to the GlyREM construct. Results are the mean of three biological replicates and the error bars represent s.e.m. d–e, Ivermectin binds at TMD intersubunit interface. Views are parallel to the membrane (d) or the extracellular side (e). f, Activation of GlyR currents by 10 mM glycine determined by TEVC. g, Strychnine (1 μM) inhibits glycine-induced (0.3 mM) currents. h, Effect of picrotoxinin (ptx, 1 mM) on glycine (0.3 mM) induced current. Ptx inhibits ~80% of glycine-induced current. Ivermectin (5 μM) potentiates the GlyR current and causes a slow desensitization. The shown recordings are representative of three independent experiments.
Figure 4
Figure 4. Conformational changes within an individual subunit
Str-, gly- and ivm/gly-bound states are in blue, yellow and red, respectively. a–c, Superimposition of the three GlyR structures using the ECD (residues 1-235), showing the motion of TMD. Relative rotation angles of the pore-lining M2 are indicated. Conformational changes in the ECD-TMD interface upon transition from the gly- (or gly/ivm-) to the str-bound states are shown in panels d and e, viewed parallel to the membrane and from the extracellular side, respectively. The displacement of the β8-β9 loop leads to a rotation of pre-M1/M1, pushing the lower half of M2 toward the pore axis; meanwhile, this displacement repositions the Cys loop through β10, which results in the coupling of the M2-M3 loop with the β1-β2 loop through the interaction between Pro291 and Thr70. Consequently, the upper half of M2 rotates outward.
Figure 5
Figure 5. Conformational differences at the subunit-subunit interface between agonist- and antagonist-bound states
Str- and gly/ivm-bound states are in blue and red, respectively. The (−)subunits are in corresponding light colors. a, Superimposition of the ECD of the (−)-subunits showing the relative movement of the (+)-subunits. In b and c are shown conformational changes of the neurotransmitter binding pocket, viewed parallel to the membrane and from the extracellular side, respectively. The neurotransmitter binding site expands in the str-bound structure caused by repositioning of Arg135 and Arg81 in the (−)-subunit and by the opening of the C loop in the (+)subunit. Panels d and e illustrate the coupling of structural rearrangements of the ECD-TMD interface between two adjacent subunits. In the str-bound form, Ser294 in the M2-M3 loop of the (+)-subunit is inserted in the M1 N-cap in the (−)-subunit. Key residues interacting with Ser294 are highlighted in the green outline. Upon binding of glycine, the M2-M3 loop moves away from the N-cap. For clarity, the side chains of Gln235 and Tyr238 are not shown.
Figure 6
Figure 6. Overall conformational changes of the TMD
Str-, gly- and gly/ivm-bound states are in blue, yellow and red, respectively. Comparison between str- and gly-GlyR (a), str- and gly/ivm-GlyR (b), gly- and gly/ivm-GlyR (c), viewed from the extracellular side. Side chains of −2′Pro and 9′Leu are shown in sticks to denote the change of pore sizes. In going from the str- to the gly-bound form, the TMD of each individual subunit undergoes a counter-clockwise outward rotation, enlarging the pore size by ‘pulling’ the side chains of 9′Leu and −2′Pro away from the channel axis. Binding of ivermectin to the gly-GlyR causes a clockwise inward rotation of the TMD. As a result, while the extracellular half of the pore undergoes little change, the intracellular entrance shrinks.

Similar articles

Cited by

References

    1. Katz B, Thesleff S. A study of the ‘desensitization’ produced by acetylcholine at the motor end-plate. J Physiol. 1957;138:63–80. - PMC - PubMed
    1. Aprison MH, Werman R. The distribution of glycine in cat spinal cord and roots. Life Sci. 1965;4:2075–83. - PubMed
    1. Curtis DR, Hosli L, Johnston GA. Inhibition of spinal neurons by glycine. Nature. 1967;215:1502–3. - PubMed
    1. Werman R, Davidoff RA, Aprison MH. Inhibition of motoneurones by iontophoresis of glycine. Nature. 1967;214:681–3. - PubMed
    1. Curtis DR, Hosli L, Johnston GA, Johnston IH. The hyperpolarization of spinal motoneurones by glycine and related amino acids. Exp Brain Res. 1968;5:235–58. - PubMed

Publication types

MeSH terms