. 2013 Sep 25;1(4):415-43.
doi: 10.3390/vaccines1040415.

DNA-Encoded Flagellin Activates Toll-Like Receptor 5 (TLR5), Nod-like Receptor Family CARD Domain-Containing Protein 4 (NRLC4), and Acts as an Epidermal, Systemic, and Mucosal-Adjuvant

Affiliations

DNA-Encoded Flagellin Activates Toll-Like Receptor 5 (TLR5), Nod-like Receptor Family CARD Domain-Containing Protein 4 (NRLC4), and Acts as an Epidermal, Systemic, and Mucosal-Adjuvant

Sanna Nyström et al. Vaccines (Basel). .

Abstract

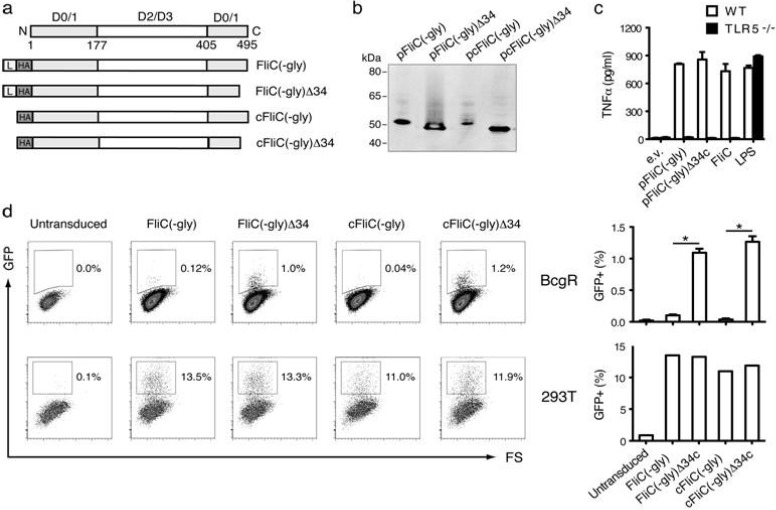
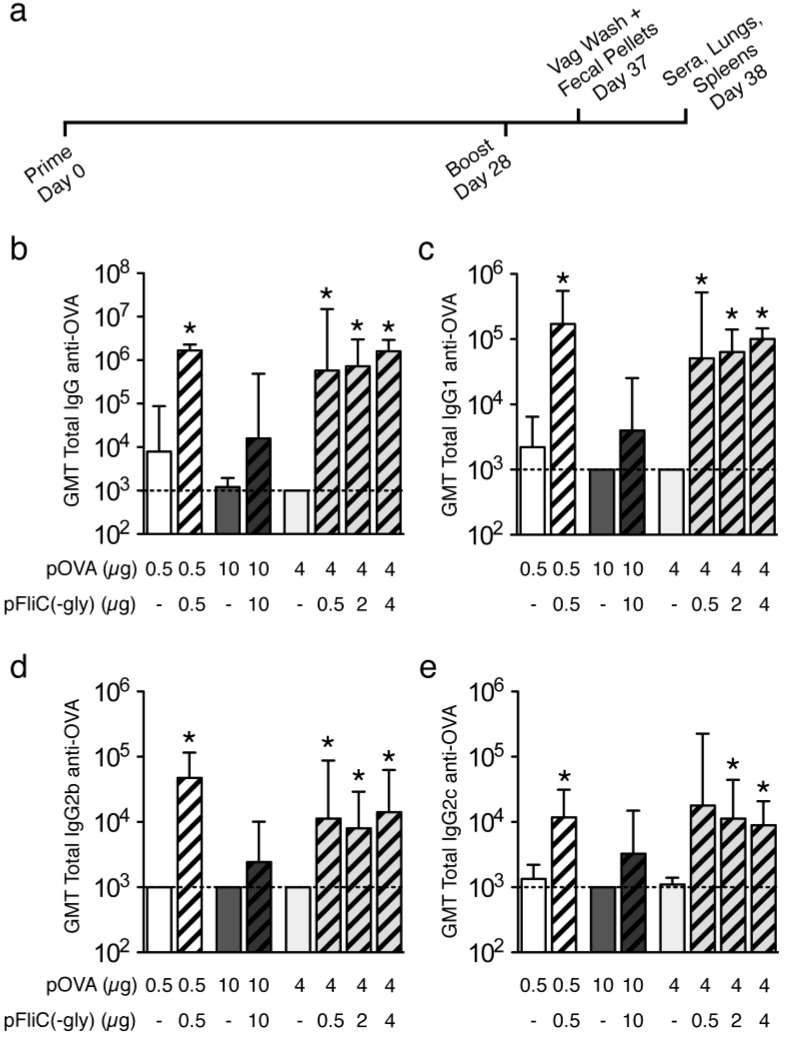
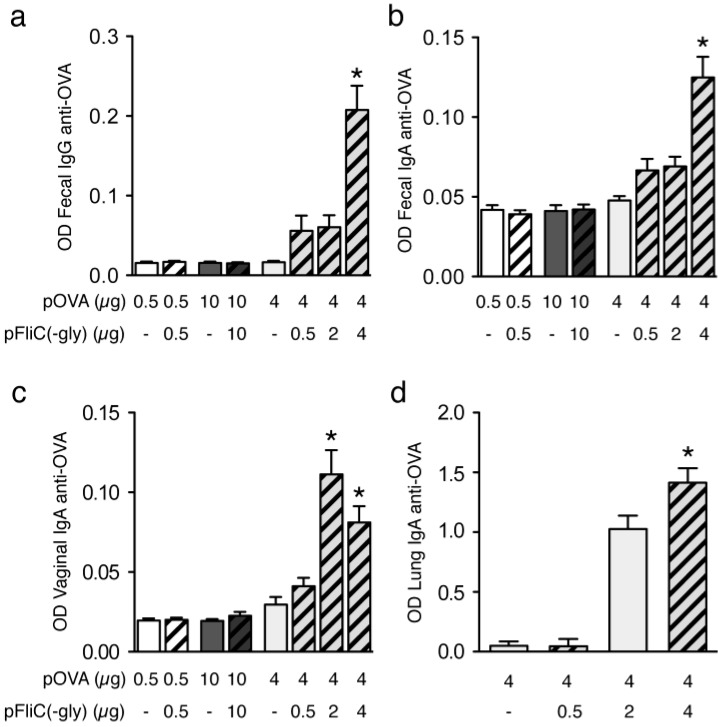
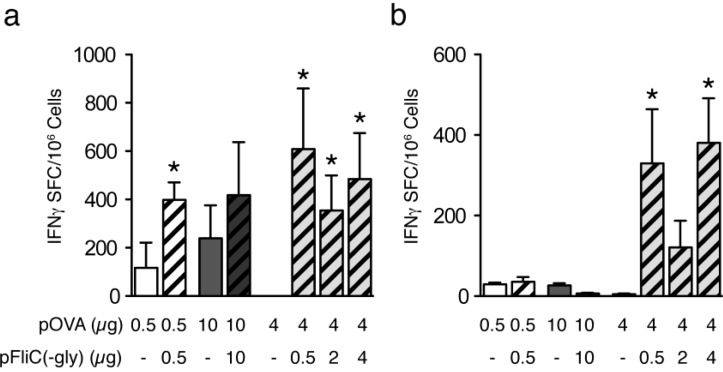
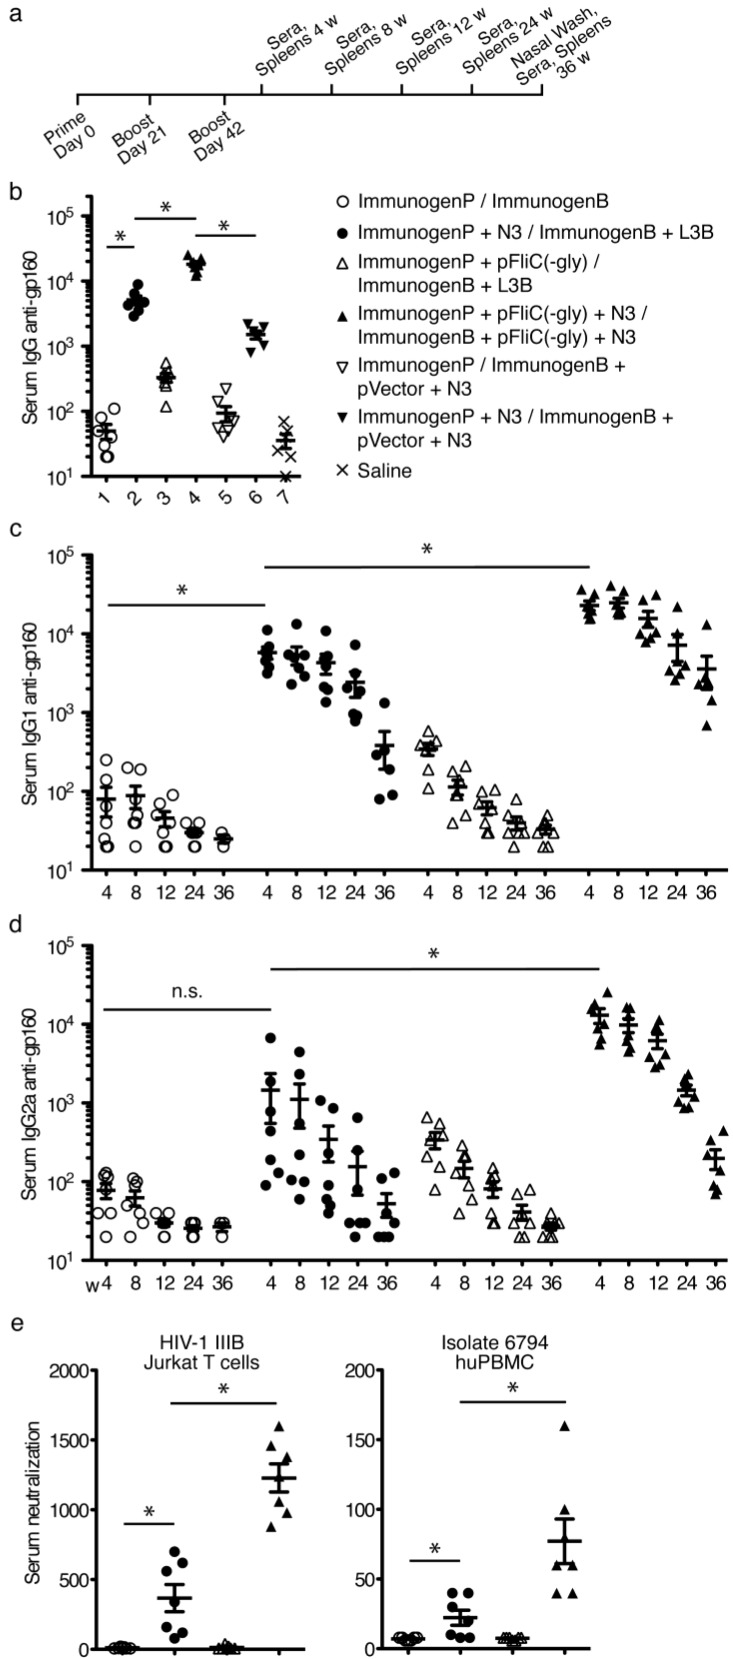
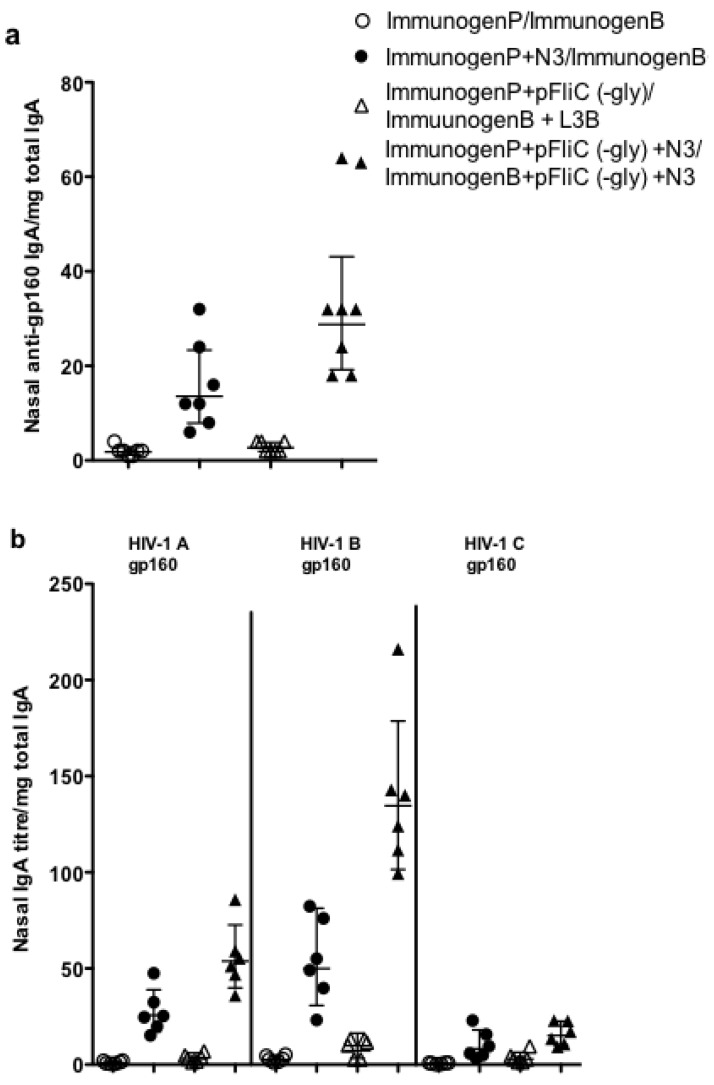
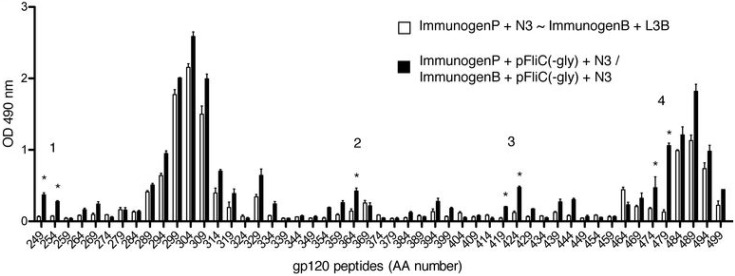
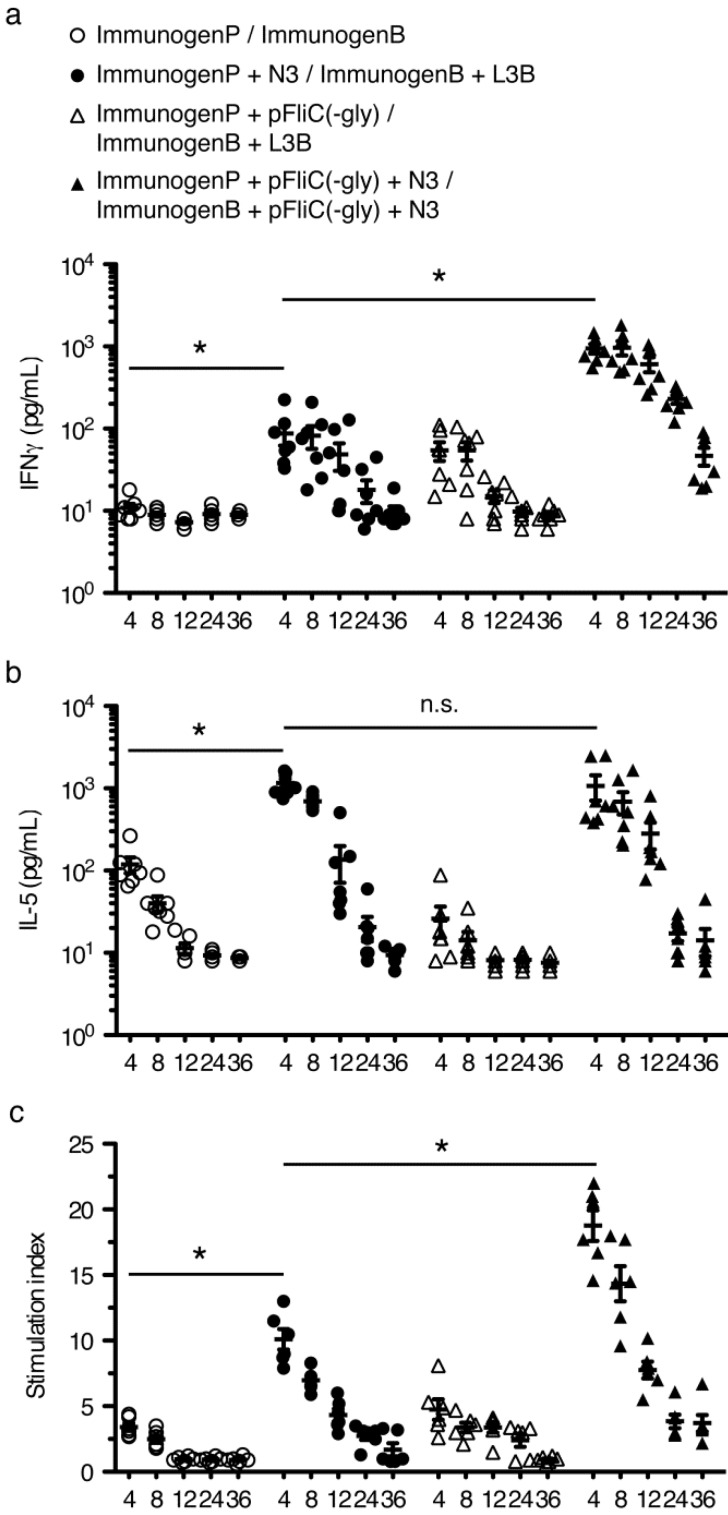
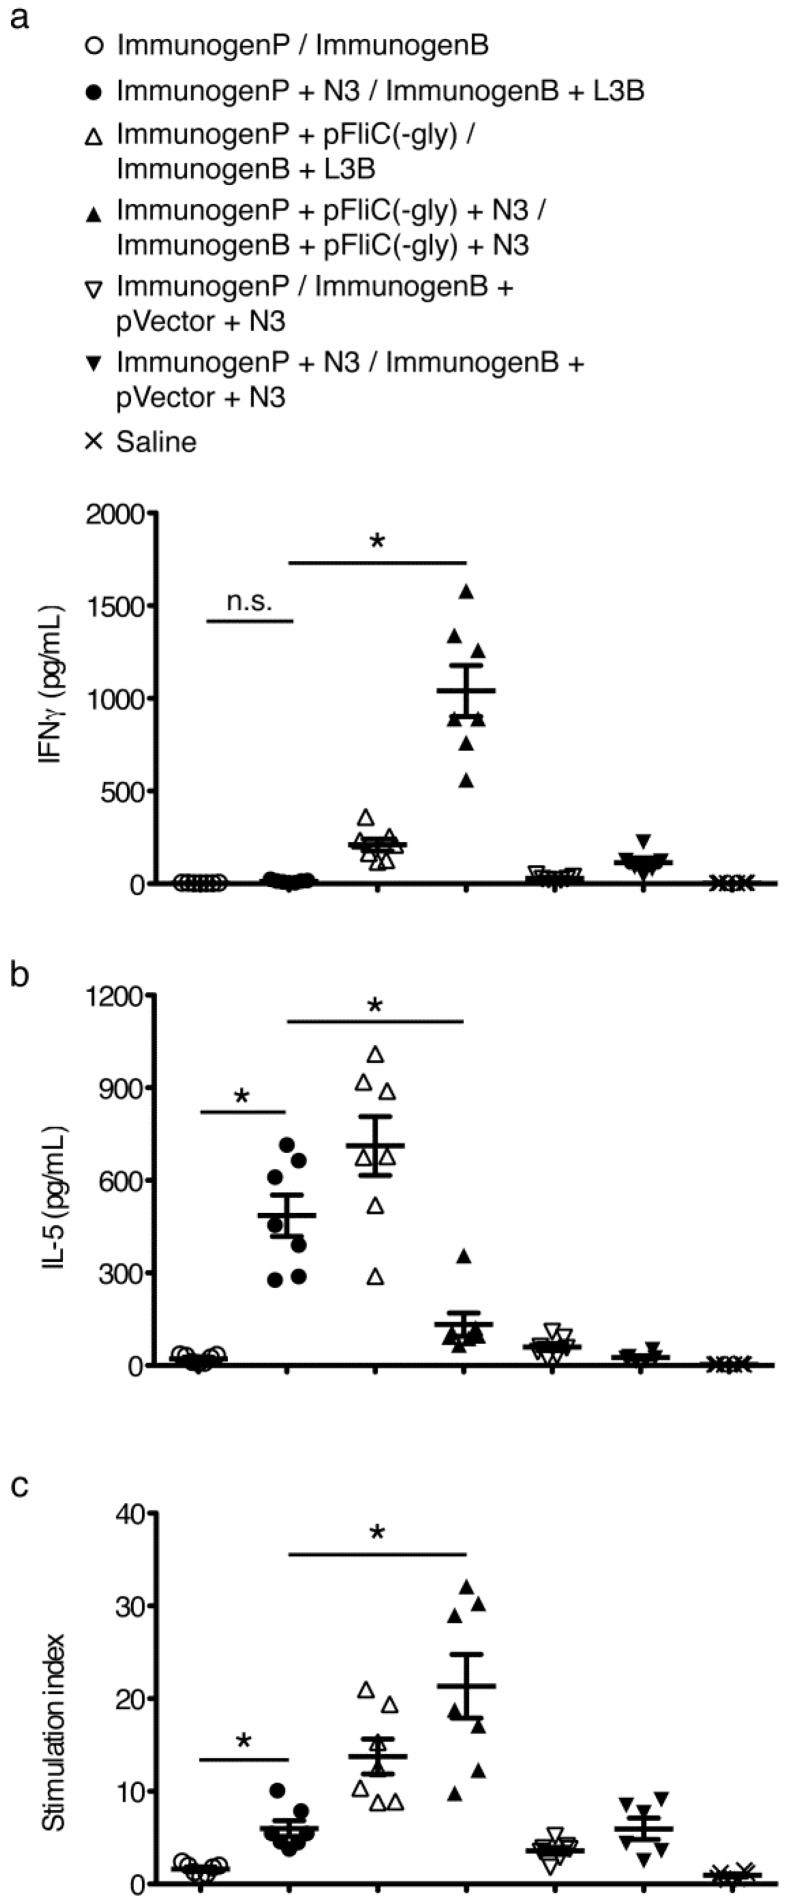
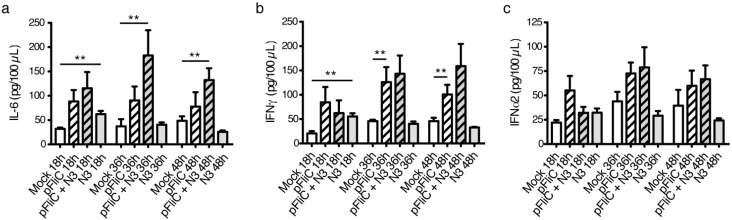
Eliciting effective immune responses using non-living/replicating DNA vaccines is a significant challenge. We have previously shown that ballistic dermal plasmid DNA-encoded flagellin (FliC) promotes humoral as well as cellular immunity to co-delivered antigens. Here, we observe that a plasmid encoding secreted FliC (pFliC(-gly)) produces flagellin capable of activating two innate immune receptors known to detect flagellin; Toll-like Receptor 5 (TLR5) and Nod-like Receptor family CARD domain-containing protein 4 (NRLC4). To test the ability of pFliC(-gly) to act as an adjuvant we immunized mice with plasmid encoding secreted FliC (pFliC(-gly)) and plasmid encoding a model antigen (ovalbumin) by three different immunization routes representative of dermal, systemic, and mucosal tissues. By all three routes we observed increases in antigen-specific antibodies in serum as well as MHC Class I-dependent cellular immune responses when pFliC(-gly) adjuvant was added. Additionally, we were able to induce mucosal antibody responses and Class II-dependent cellular immune responses after mucosal vaccination with pFliC(-gly). Humoral immune responses elicited by heterologus prime-boost immunization with a plasmid encoding HIV-1 from gp160 followed by protein boosting could be enhanced by use of pFliC(-gly). We also observed enhancement of cross-clade reactive IgA as well as a broadening of B cell epitope reactivity. These observations indicate that plasmid-encoded secreted flagellin can activate multiple innate immune responses and function as an adjuvant to non-living/replicating DNA immunizations. Moreover, the capacity to elicit mucosal immune responses, in addition to dermal and systemic properties, demonstrates the potential of flagellin to be used with vaccines designed to be delivered by various routes.

Keywords: DNA adjuvant; NLRC4; TLR5; adaptive immunity; flagellin.


Figures

Figure 1
Figure 1
Flagellin (FliC)(-gly) variants for in vivo and in vitro use activate innate immune responses. (a) Depiction of pFliC(-gly) and variants relative to FliC polypeptide and domains produced by S. typhimurium. Grey domains D0/1 indicate conserved regions important for activating innate immune responses. L and HA indicates a leader and HA-epitope tag domains respectively. Names of the four FliC(-gly) constructs used in this study are indicated to the right of the drawings; (b) Western blot analysis of cellular lysates from 293T cells transfected with the indicated constructs. Apparent molecular weights were determined by comparison to the standard depicted to the left of the blot. Signals were not detected from cells transfected with empty vector (data not shown); (c) Release of TNFα from B6 alveolar macrophages but not Toll-like Receptor 5 (TLR5) −/− alveolar macrophages after stimulation with FliC(-gly) and FliC(-gly)Δ34. Supernatant from 293T cells transfected with pFliC(-gly) and pFliC(-gly)Δ34 vectors was incubated with cells for 4 h followed by analysis of secreted TNFα by ELISA. Data are mean ± SEM of triplicate samples representative of two independent experiments; (d) Activation of pyroptotic cell death by retroviral transduction of BcgR macrophages with constructs expressing FliC(-gly) but not FliC(-gly)Δ34 as determined by GFP expression. Upper panels represent representative data from BcgR cells transduced with FliC(-gly), FliC(-gly)Δ34 and controls (as indicated) when comparing GFP and forward-scatter (FS) parameters. Quantitative data of the percentage of GFP positive BcgR cells from each construct after transduction. Lower panel represent representative data from 293T cells transduced in identical fashion. Data are mean ± SEM of GFP positive cells observed during three independent transduction experiments. * Differences of the response relative to the FliC(-gly) construct without Δ34 defined as p ≤ 0.05 calculated using a two-tailed unpaired Student t test.
Figure 2
Figure 2
Vaccination schedule and serum antibody responses to OVA. (a) Immunization and sample isolation timeline; (b) Anti-OVA total IgG responses. Anti-OVA IgG1 (c), IgG2b (d), IgG2c (e) responses. (White bars) g.g. (Dark Grey Bars) i.m. (Grey bars) i.na. immunized mice. Striped bars indicate the use of pFliC(-gly). Results are representative of two independent experiments (n = 7–8 mice/group). The concentration of OVA-specific Abs are expressed as the reciprocal of the last dilution of samples giving an OD equal to, or higher than, the mean + 3 SDs (the determined cutoff value for the assay) of the values of serum samples from unimmunized mice. Absorbance values equal to or above the cutoff value were considered positive. The error bars represent 95% confidence intervals calculated from the geometric mean titers. * Differences of the response relative to pOVA immunizations without pFliC(-gly) defined as p ≤ 0.05 were considered significant using a two-tailed unpaired Student t test.
Figure 3
Figure 3
Mucosal antibody responses to OVA. (a) Fecal anti-OVA IgG and (b) IgA responses; (c) Vaginal anti-OVA IgA responses. (White bars) g.g. (Dark Grey Bars) i.m. (Grey bars) i.na. immunized mice. Striped bars indicate the use of pFliC(-gly); (d) Lung anti-OVA IgA responses shown are from mice only vaccinated i.na. and immunizations given are shown below the axis. Results are representative of two independent experiments (n = 7–8 mice/group). The concentration of OVA-specific Abs in samples are expressed as OD equal to, or higher than, the mean OD of the values of samples from unimmunized mice. The error bars represent SEM calculated from the mean OD. * Differences of the response relative to pOVA immunizations without pFliC(-gly) defined as p ≤ 0.05 were considered significant using a two-tailed unpaired Student t test.
Figure 4
Figure 4
Class I- and Class II-dependent T cell responses to OVA. IFNγ ELISPOT analysis of splenic T cell responses to (a) Class-I and (b) Class-II MHC binding OVA peptides after vaccination. (White bars) g.g. (Dark Grey Bars) i.m. (Grey bars) i.na. immunized mice. Striped bars indicate the use of pFliC(-gly). Results are representative of two independent experiments (n = 7–8 mice/group). Data is expressed as the calculated geometric mean of the Ag-stimulated cells minus unstimulated cells. The error bars representSEM calculated from the mean SFC/106 splenocytes. Statistical analyses were conducted using a two-tailed Student t test. * Differences of the response relative to pOVA immunizations without pFliC(-gly) defined as p ≤ 0.05 were considered significant using an two-tailed unpaired student t test.
Figure 5
Figure 5
Vaccination schedule, serum antibody responses to gp160, and virus neutralization titers. (a) Immunization and sample isolation timeline. Priming (ImmunogenP, plasmids) and boostings (ImmunogenB, rec proteins) are indicated in days while time after the final boost are indicated in weeks. Immunization details are listed in Table 2; (b) Serum IgG titer against rgp160 at 4 weeks post immunization in all seven study groups; (c) Serum titer anti-rgp160IgG1 isotype kinetics in the four first study groups in Table 2; (d) Serum end-point titer anti-rgp160 IgG2a isotype kinetics in the four first study groups. The concentration of rgp160-specific Abs are expressed as the end-point titers giving an OD equal to, or higher than, the mean + 3 SDs (the determined cutoff value for the assay) of the values of serum samples from unimmunized mice. Absorbance values equal to or above the cutoff value were considered positive; (e) Serum neutralization of HIV shown as IC50 in serum samples of the four first study groups in Table 2. The TCID50 (the reciprocal of the virus dilution where 50% of the cultures were infected) of IIIB (LAI) or 6794 was incubated with sample mouse serum (dilutions: 20, 60, 180, 540, 1 620). 5 × 10⁴ cells well were then added, incubated, washed, and incubated for 7 days. Culture supernatants were tested for virus production by HIV-1 p24 capture ELISA. The lowest serum concentration giving a 50% reduction (IC50) of ELISA absorbance value compared with the mean of the negative controls are presented [19]. Statistical analyses were conducted using a two-tailed unpaired Student t test. * Differences of the responses between compared groups defined as p ≤ 0.05 were considered significant. n.s. = non-significant. Comparisons between groups with the HIV-1 antigens were performed by using the non-parametric Mann-Whitney U test with Bonferroni correction, p < 0.05 was considered significant.
Figure 6
Figure 6
Mucosal antibody responses to gp160. (a) Nasal IgA anti-rgp160; (b) Nasal IgA anti-gp160 cross-reactivity against clade A, B, and C envelope antigens. Priming (ImmunogenP, plasmids) and boosting (ImmunogenB, rec proteins) groups are shown in the key. Immunization details are listed in Table 2. ELISA was performed using individual serum from the indicated immunization groups. Absorbance values equal to or above the cutoff value were considered positive. Statistical analyses were conducted using a two-tailed unpaired Student t test. * Differences of the responses between compared groups defined as p ≤ 0.05 were considered significant.
Figure 7
Figure 7
B cell epitope mapping to C2-C5 region of gp160 after immunization with gp160 with and without adjuvant. ELISA was performed using group-pooled serum (equal volumes) from immunization group 2 (n = 35) or 4 (n = 35) against individual peptides. Priming (ImmunogenP, plasmids) and boosting (ImmunogenB, rec proteins) groups are shown in the key. Immunization details are listed in Table 2. The concentration of gp160-peptide specific Abs are expressed as the end-point titers giving an OD equal to, or higher than, the mean + 3 SDs (the determined cutoff value for the assay) of the values of serum samples from unimmunized mice. Absorbance values equal to or above the cutoff value were considered positive. Statistical analyses were conducted using a two-tailed unpaired Student t test. * Differences of the responses between compared groups defined as p ≤ 0.05 were considered significant.
Figure 8
Figure 8
Kinetic analysis of T cell responses to immunizations with gp160 with and without adjuvant combinations. (a) Anti-mIFNγ ELISA was performed on cells restimulated with rgp160. Values shown were adjusted for baseline values seen using identical stimulations using splenocytes from naive mice. Priming (ImmunogenP, plasmids) and boosting (ImmunogenB, rec proteins) groups are shown in the key. Immunization details are listed in Table 2; (b) Anti-mIL-5 ELISA was performed on cells restimulated with rgp160. Values shown were adjusted for baseline values seen using identical stimulations using splenocytes from naïve mice; (c) Proliferative response to stimulation with rgp160 defined as stimulation index relative to identical stimulations using splenocytes from naïve mice. Statistical analyses were conducted using a two-tailed unpaired Student t test. * Differences of the responses between compared groups at week 4 after final boost defined as p ≤ 0.05 were considered significant. n.s. = non-significant. Comparisons between groups with the HIV-1 antigens were performed by using the non-parametric Mann-Whitney U test with Bonferroni correction, p < 0.05 was considered significant.
Figure 9
Figure 9
Analysis of T cell responses to immunizations with p24gag with and without adjuvant combinations. (a) Anti-mIFNγ ELISA was performed on cells restimulated with p24gag. Values shown were adjusted for baseline values seen using identical stimulations using splenocytes from naïve mice. Priming (ImmunogenP, plasmids) and boosting (ImmunogenB, rec proteins) groups are shown in the key. Immunization details are listed in Table 2; (b) Anti-mIL-5 ELISA was performed on cells restimulated with p24gag. Values shown were adjusted for baseline values seen using identical stimulations using splenocytes from naïve mice; (c) Proliferative response to stimulation with p24gag defined as stimulation index relative to identical stimulations using splenocytes from naïve mice. Statistical analyses were conducted using a two-tailed unpaired Student t test. * Differences of the responses between compared groups at week 4 after final boost defined as p ≤ 0.05 were considered significant. n.s. = non-significant. Comparisons between groups with the HIV-1 antigens were performed by using the non-parametric Mann-Whitney U test with Bonferroni correction, p < 0.05 was considered significant.
Figure 10
Figure 10
Cytokines produced after intranasal adminstration of adjuvant combinations. Kinetic analysis of (a) IL-6, (b) IFNγ, and IFNα2 (c) at 18, 36, and 48 h by ELISA using nasal wash samples. Mock adjuvant shown as White bars, use of pFliC(-gly) as Striped Bars, and N3 as Grey bars (n = 5 mice/group). Data is expressed as the calculated mean ± SEM. Statistical analyses were conducted using a two-tailed Mann-Whitney test. ** Differences relative compared groups defined as p ≤ 0.005 were considered significant.

Similar articles

Cited by

References

    1. Jones S., Evans K., McElwaine-Johnn H., Sharpe M., Oxford J., Lambkin-Williams R., Mant T., Nolan A., Zambon M., Ellis J., et al. DNA vaccination protects against an influenza challenge in a double-blind randomised placebo-controlled phase 1b clinical trial. Vaccine. 2009;27:2506–2512. doi: 10.1016/j.vaccine.2009.02.061. - DOI - PubMed
    1. Girard M.P., Bansal G.P. HIV/AIDS vaccines: A need for new concepts? Int. Rev. Immunol. 2008;27:447–471. doi: 10.1080/08830180802432160. - DOI - PubMed
    1. Jechlinger W. Optimization and delivery of plasmid DNA for vaccination. Expert Rev. Vaccines. 2006;5:803–825. doi: 10.1586/14760584.5.6.803. - DOI - PubMed
    1. Miao E.A., Andersen-Nissen E., Warren S.E., Aderem A. TLR5 and Ipaf: Dual sensors of bacterial flagellin in the innate immune system. Semin. Immunopathol. 2007;29:275–288. doi: 10.1007/s00281-007-0078-z. - DOI - PubMed
    1. Applequist S.E., Rollman E., Wareing M.D., Liden M., Rozell B., Hinkula J., Ljunggren H.G. Activation of innate immunity, inflammation, and potentiation of DNA vaccination through mammalian expression of the TLR5 agonist flagellin. J. Immunol. 2005;175:3882–3891. - PubMed

LinkOut - more resources