. 2015 Dec;104(12):4409-4416.
doi: 10.1002/jps.24631. Epub 2015 Sep 7.

A Flow Cytometric Clonogenic Assay Reveals the Single-Cell Potency of Doxorubicin

Affiliations

A Flow Cytometric Clonogenic Assay Reveals the Single-Cell Potency of Doxorubicin

Katie F Maass et al. J Pharm Sci. 2015 Dec.

Abstract

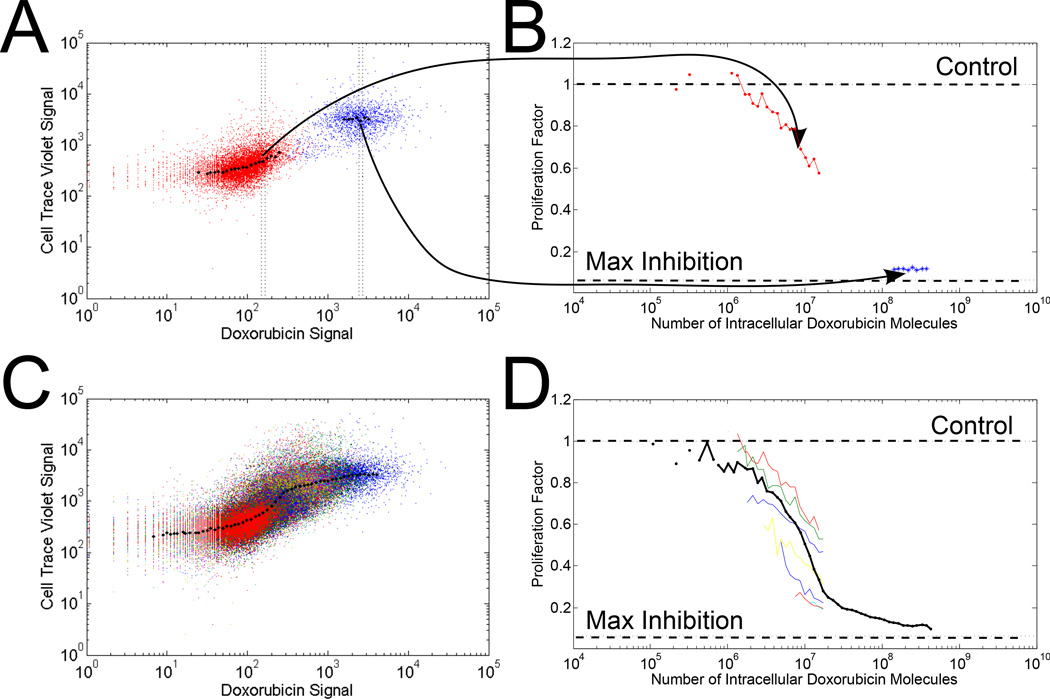
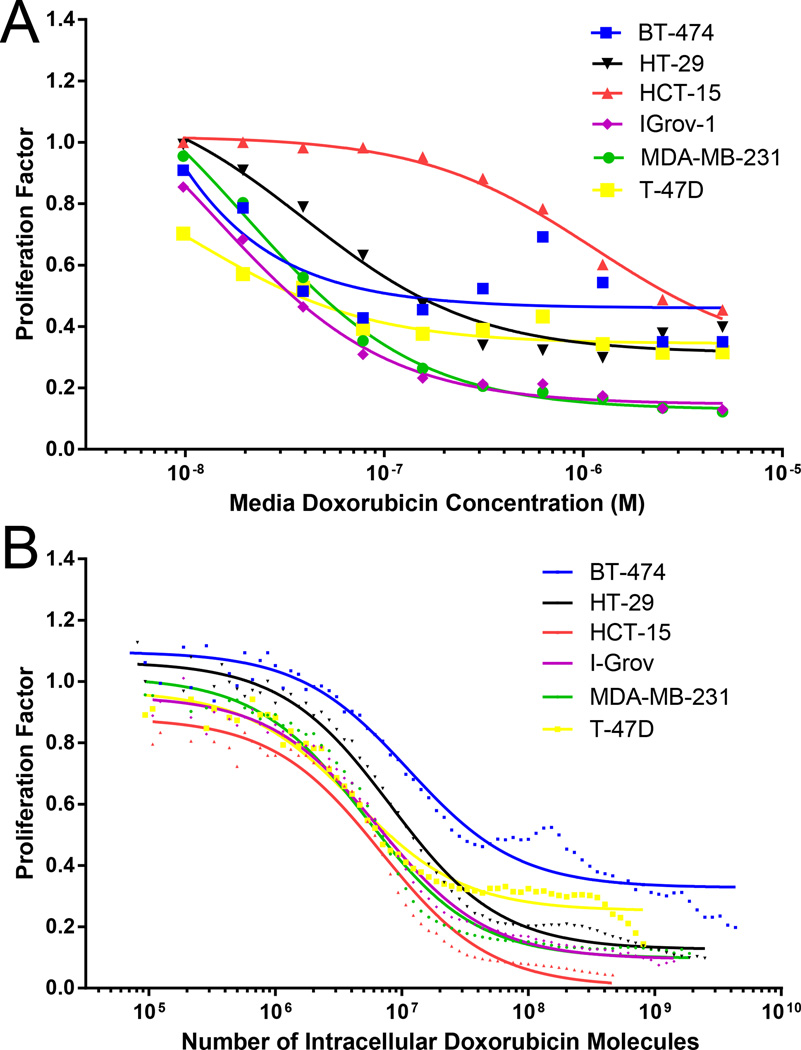
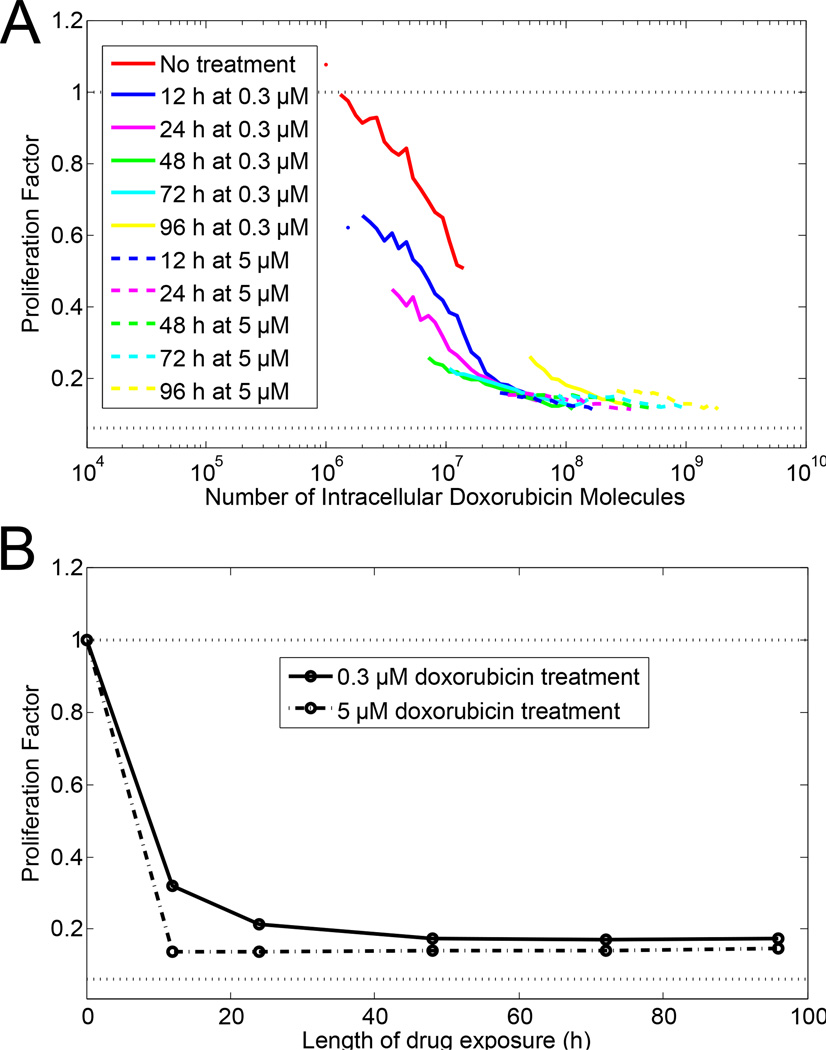
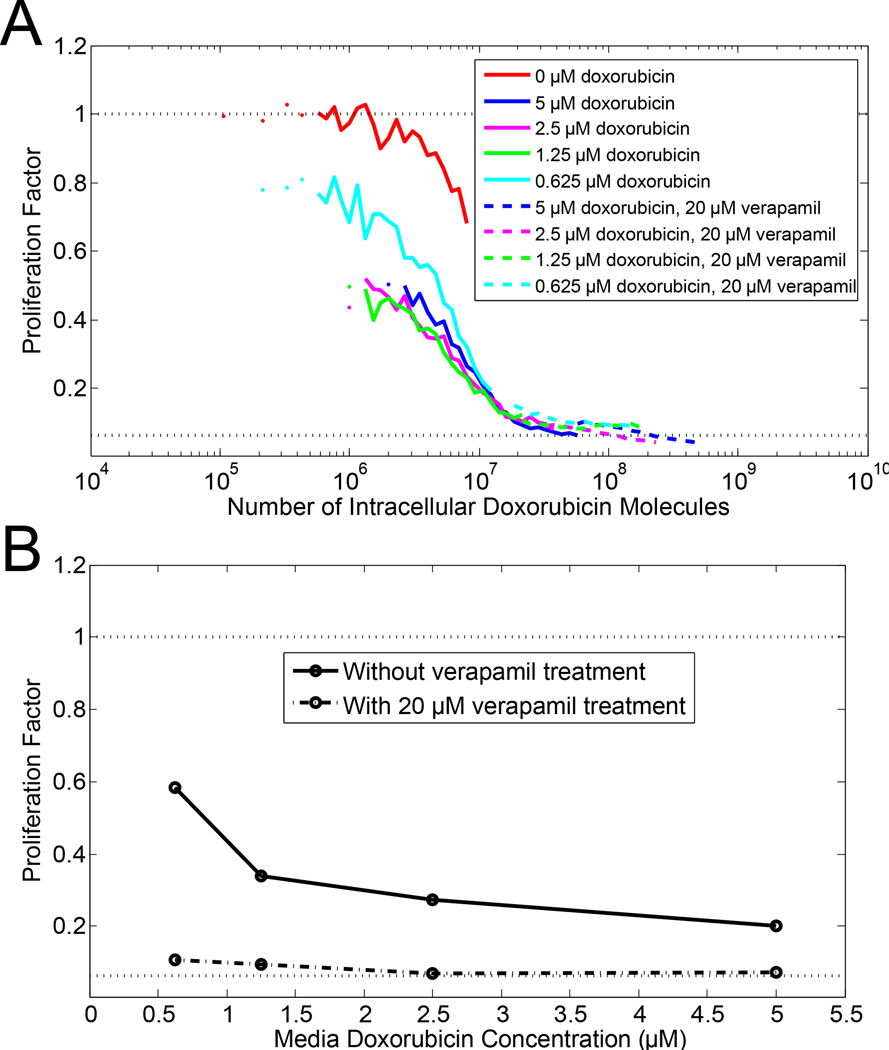
Standard cell proliferation assays use bulk media drug concentration to ascertain the potency of chemotherapeutic drugs; however, the relevant quantity is clearly the amount of drug actually taken up by the cell. To address this discrepancy, we have developed a flow cytometric clonogenic assay to correlate the amount of drug in a single cell with the cell's ability to proliferate using a cell tracing dye and doxorubicin, a naturally fluorescent chemotherapeutic drug. By varying doxorubicin concentration in the media, length of treatment time, and treatment with verapamil, an efflux pump inhibitor, we introduced 10(5) -10(10) doxorubicin molecules per cell; then used a dye-dilution assay to simultaneously assess the number of cell divisions. We find that a cell's ability to proliferate is a surprisingly conserved function of the number of intracellular doxorubicin molecules, resulting in single-cell IC50 values of 4-12 million intracellular doxorubicin molecules. The developed assay is a straightforward method for understanding a drug's single-cell potency and can be used for any fluorescent or fluorescently labeled drug, including nanoparticles or antibody-drug conjugates.

Keywords: cancer chemotherapy; cell lines; drug effects; efflux pumps; pharmacodynamics.


Figures

Figure 1
Figure 1
Data processing steps (A) The raw flow cytometry results for the control population (stained with CellTrace, no doxorubicin treatment) are shown in red and the highest doxorubicin treatment population (5 µM doxorubicin in media) are shown in blue. (B) Conversion of fluorescence signals to number of intracellular doxorubicin molecules and the proliferation factor are shown for cell populations shown in A. The horizontal lines illustrate growth equivalent to untreated cells and maximum inhibition with a cell doubling rate of 24 h for untreated cells. (C) and (D) demonstrate the same transformation as in (A) and (B) with the full range (10 nM – 5 µM) of media doxorubicin treatment concentrations. In (D), each color represents an individual doxorubicin media concentration. The solid black line is the resulting response curve from the concatenation of all cell treatment data.
Figure 2
Figure 2
Cell proliferation response to doxorubicin treatment. Flow cytometric clonogenic assay results are shown with (A) media doxorubicin concentration as the basis and (B) intracellular doxorubicin concentration as the basis. Data were processed in same manner described in Fig. 1. Lines represent thecurves for IC50 value fits. In (A), the data points represent the median proliferation factor for a given media doxorubicin treatment, whereas in (B), the data points represent bins from the concatenation of all treatment conditions and replicates.
Figure 3
Figure 3
Effect of length of drug exposure on cell proliferation. MDA-MB-231 cells were treated with a moderate drug concentration (0.3 µM, solid lines) or high drug concentration (5 µM, dashed lines). (A) Flow cytometric clonogenic assay with cell proliferation as a function of amount of doxorubicin in cells. Length of doxorubicin exposure is given by different colors as described in legend. (B) Proliferation as a function of the length of doxorubicin exposure with either 0.3 µM media doxorubicin concentration (solid line) or 5 µM media doxorubicin concentration (dashed line).
Figure 4
Figure 4
Effect of verapamil treatment on cell proliferation. HCT-15 cells, which express the drug efflux pump P-glycoprotein (Pgp), were treated with doxorubicin in the presence (dashed lines) and absence (solid lines) of 20 µM verapamil, a Pgp inhibitor. (A) Flow cytometric clonogenic assay with cell proliferation as a function of amount of intracellular doxorubicin in cells. Doxorubicin media concentration is given by different colors as described in legend. (B) Proliferation as a function of the media doxorubicin concentration with (dashed line) or without (solid line) 20 µM verapamil.
Scheme 1
Scheme 1
Synthesis of Doxorubicin–SMCC

References

    1. Fotakis G, Timbrell Ja. In vitro cytotoxicity assays: comparison of LDH, neutral red, MTT and protein assay in hepatoma cell lines following exposure to cadmium chloride. Toxicol. Lett. 2006;160:171–177. - PubMed
    1. Weyermann J, Lochmann D, Zimmer A. A practical note on the use of cytotoxicity assays. Int. J. Pharm. 2005;288:369–376. - PubMed
    1. Gottesman MM. Mechanisms of cancer drug resistance. Annu. Rev. Med. 2002;53:615–627. - PubMed
    1. Pirie CM, Hackel BJ, Rosenblum MG, Wittrup KD. Convergent potency of internalized gelonin immunotoxins across varied cell lines, antigens, and targeting moieties. J. Biol. Chem. 2011;286:4165–4172. - PMC - PubMed
    1. Sundman-Engberg B, Tidefelt U, Liliemark J, Paul C. Intracellular concentrations of anti cancer drugs in leukemic cells in vitro vs in vivo. Cancer Chemother. 1990:252–256. - PubMed

Publication types

LinkOut - more resources