. 2015 Sep 7:4:e08440.
doi: 10.7554/eLife.08440.

Network structure of brain atrophy in de novo Parkinson's disease

Affiliations

Network structure of brain atrophy in de novo Parkinson's disease

Yashar Zeighami et al. Elife. .

Abstract

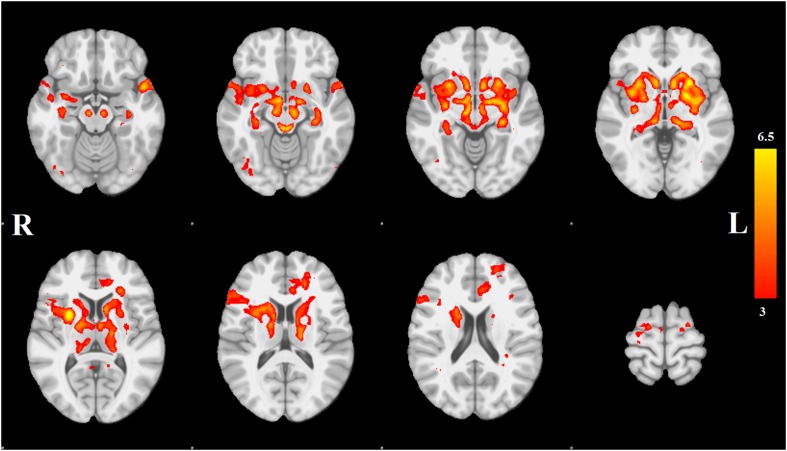
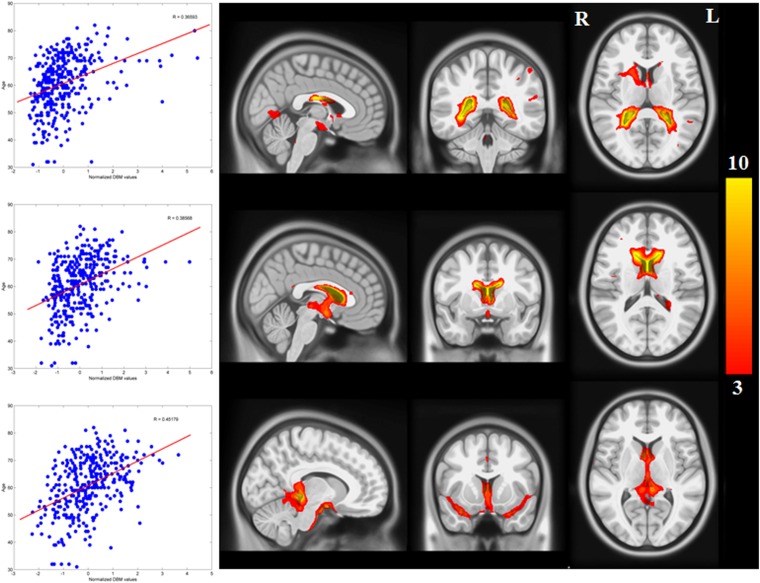
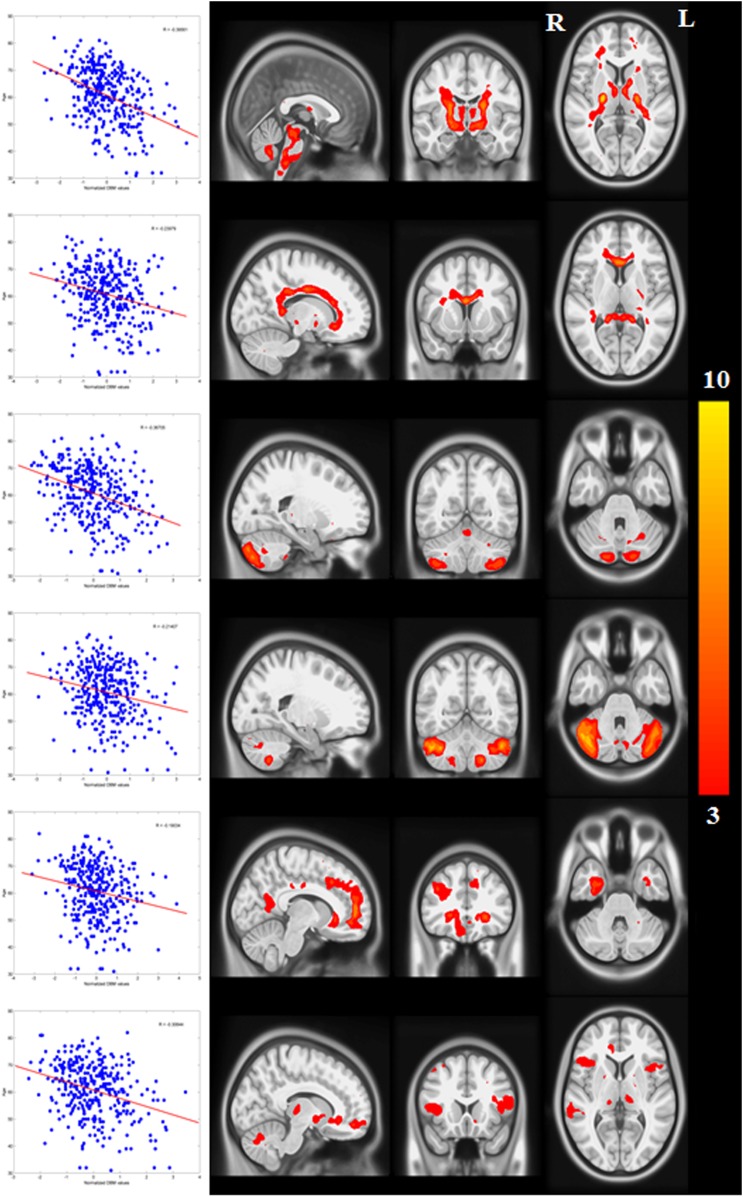
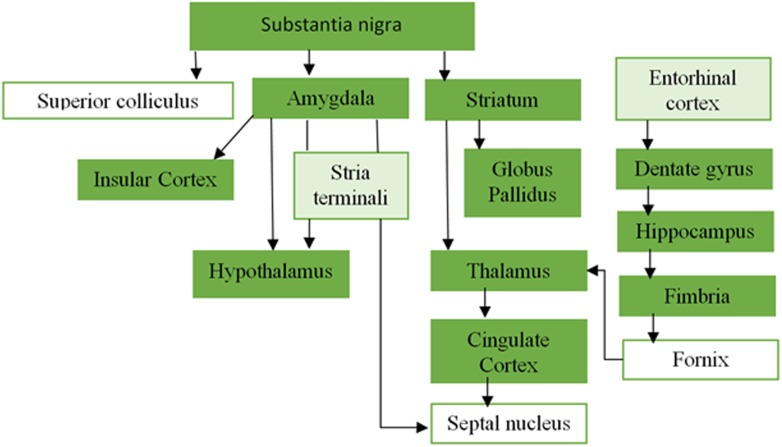
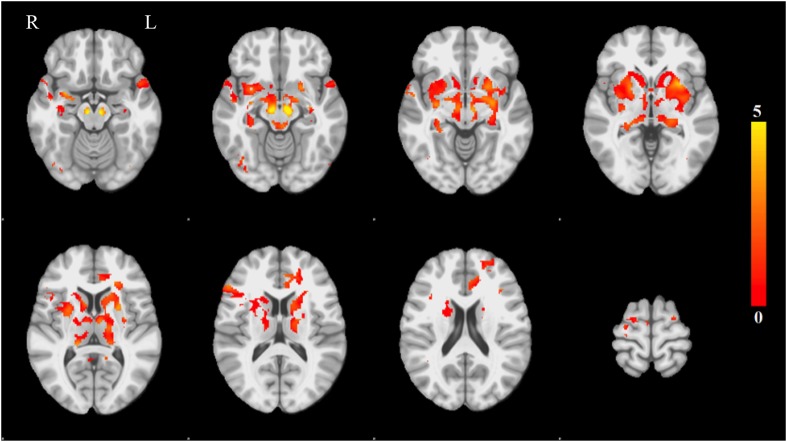
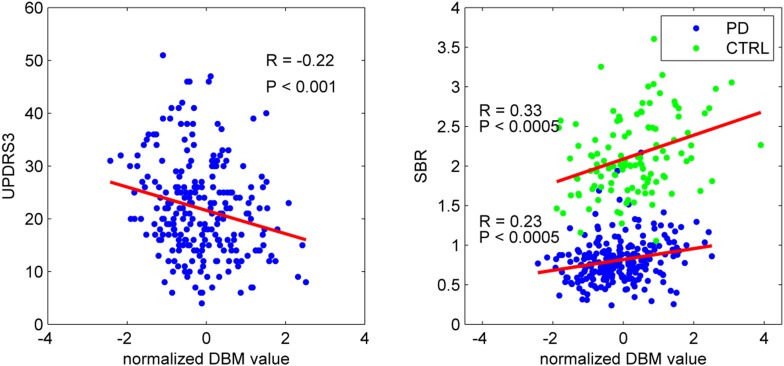
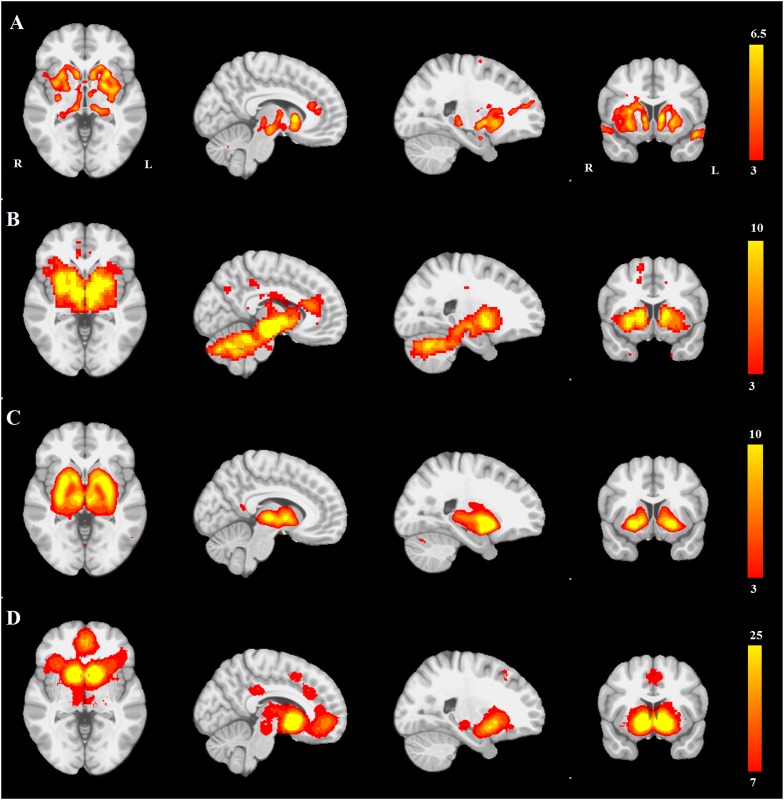
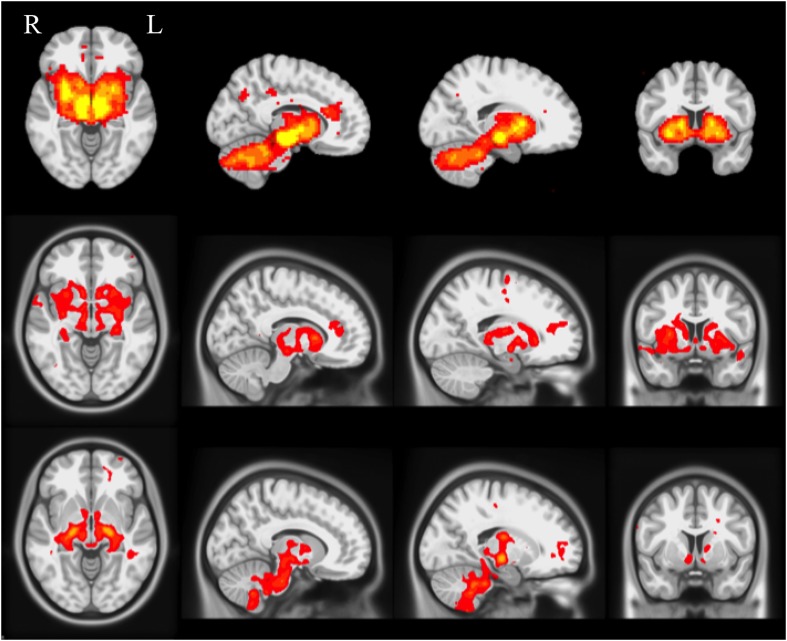
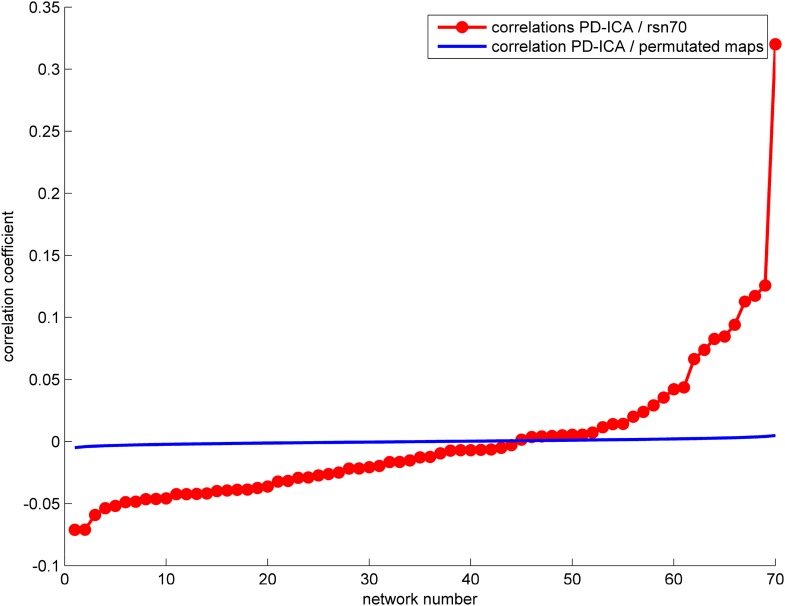
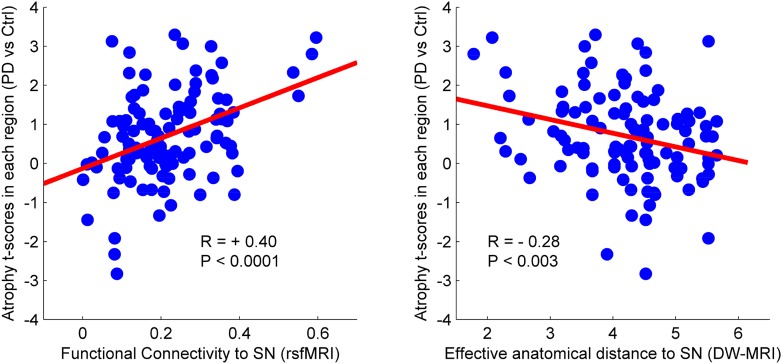
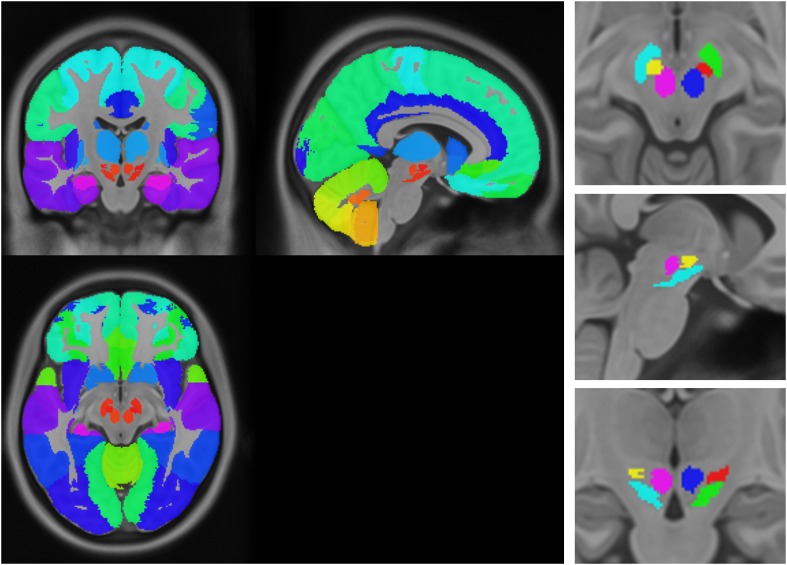
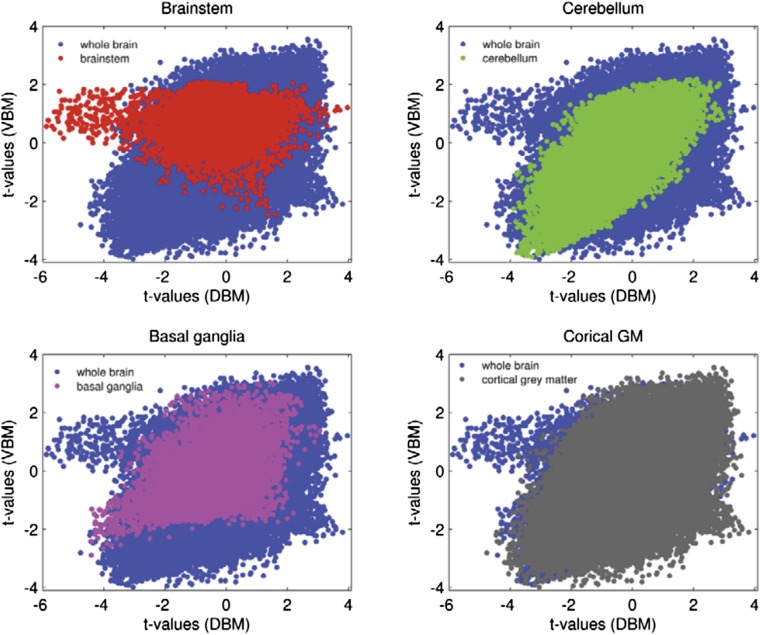
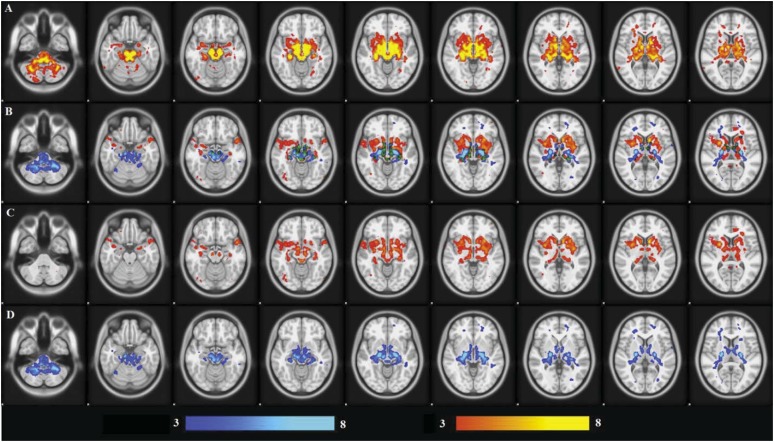
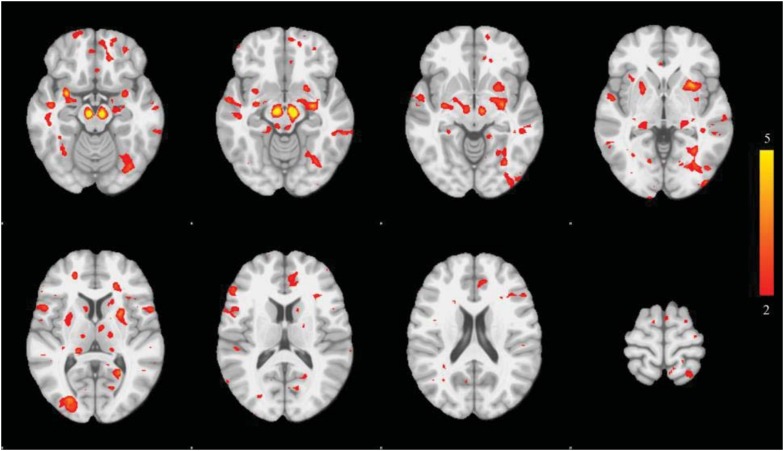
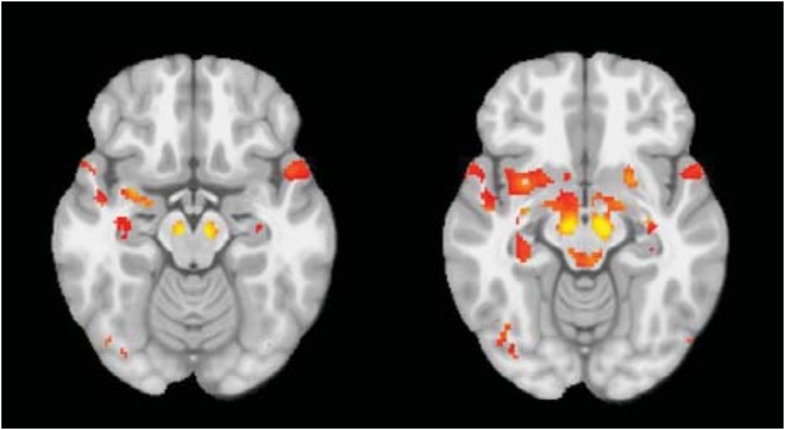
We mapped the distribution of atrophy in Parkinson's disease (PD) using magnetic resonance imaging (MRI) and clinical data from 232 PD patients and 117 controls from the Parkinson's Progression Markers Initiative. Deformation-based morphometry and independent component analysis identified PD-specific atrophy in the midbrain, basal ganglia, basal forebrain, medial temporal lobe, and discrete cortical regions. The degree of atrophy reflected clinical measures of disease severity. The spatial pattern of atrophy demonstrated overlap with intrinsic networks present in healthy brain, as derived from functional MRI. Moreover, the degree of atrophy in each brain region reflected its functional and anatomical proximity to a presumed disease epicenter in the substantia nigra, compatible with a trans-neuronal spread of the disease. These results support a network-spread mechanism in PD. Finally, the atrophy pattern in PD was also seen in healthy aging, where it also correlated with the loss of striatal dopaminergic innervation.

Keywords: MRI; basal ganglia; deformation-based morphometry; human; independent component analysis; neuroscience; substantia nigra.


Conflict of interest statement

The authors declare that no competing interests exist.

Figures

Figure 1.
Figure 1.. Distribution of atrophy in Parkinson's disease.
This image displays the only one of the 30 independent component analysis (ICA) networks showing a significant difference between Parkinson's disease (PD) and Controls (p = 0.003 after correction for multiple comparison). The ICA spatial map was converted to a z-statistic image via a normalized mixture–model fit and then thresholded at z = 3. Selected sections in Montreal Neurological Institute (MNI) space at coordinates z = −16, z = −12, z = −7, z = −2, z = 8, z = 14, z = 20, z = 70. See Tables 1, 2 for anatomical localization. Note that the value at each voxel is the z-score of the ICA component, not the group difference. DOI: http://dx.doi.org/10.7554/eLife.08440.003
Figure 1—figure supplement 1.
Figure 1—figure supplement 1.. Networks with positive correlation between average deformation and age.
The average deformation for each subject in all 30 ICA networks was correlated with age. 10 networks showed a significant correlation after Bonferroni correction. The three components depicted here show a significant positive effect of age (expansion). They represent cerebrospinal fluid spaces. DOI: http://dx.doi.org/10.7554/eLife.08440.004
Figure 1—figure supplement 2.
Figure 1—figure supplement 2.. Networks with negative correlation between average deformation and age.
(The PD-ICA network is not shown here, but it also displays a correlation with age.) DOI: http://dx.doi.org/10.7554/eLife.08440.005
Figure 1—figure supplement 3.
Figure 1—figure supplement 3.. Overlapping areas between the PD-ICA network obtained from the PPMI data set and regions from Masuda-Suzukake et al. (2013).
Plot of the regions from Masuda-Suzukake et al. (2013) that demonstrated synucleinopathy after injection of pathogenic synuclein fibrils in the substantia nigra, and their anatomical connectivity. The dark green regions were present in the PD-ICA network in the current analysis after thresholding with z > 3. Entorhinal cortex and stria terminali depicted with light green were marginally outside the map 2.7 < z < 3. DOI: http://dx.doi.org/10.7554/eLife.08440.006
Figure 1—figure supplement 4.
Figure 1—figure supplement 4.. Voxel-wise difference in atrophy between PD and controls.
This map displays the univariate z-score of the group difference in atrophy at each voxel within the PD-ICA. DOI: http://dx.doi.org/10.7554/eLife.08440.007
Figure 2.
Figure 2.. PD-ICA network, dopamine denervation, and severity of disease.
Left: Unified Parkinson's Disease Rating Scale (UPDRS) part III (a measure of motor function and disease severity—higher value means more severe disease) was significantly correlated with the degree of atrophy in the network (r = −0.22, p < 0.001). Right: plot of [123I]FP-CIT striatum binding ratio (SBR) vs deformation value in the PD-ICA (Figure 1). Correlation: r = 0.23, p < 0.0005 for PD patients, and r = 0.33, p < 0.0005 for age-matched controls. DOI: http://dx.doi.org/10.7554/eLife.08440.010
Figure 3.
Figure 3.. PD atrophy resembles normal intrinsic connectivity networks.
Selected sections for (A) PD-ICA network from the Parkinson's Progression Markers Initiative (PPMI) data set thresholded at z = 3. (B) Seed-based resting-state functional MRI (fMRI) connectivity with substantia nigra as a priori seed. (C) Intrinsic connectivity network (ICN) correlated with PD-ICA from Smith et al. (2009). (D) Regions responding to stimulus value during fMRI (meta-analysis of Bartra et al., 2013) (Selected slices in MNI space z = −2, x = −8, x = −23, y = 10.) DOI: http://dx.doi.org/10.7554/eLife.08440.011
Figure 3—figure supplement 1.
Figure 3—figure supplement 1.. Selected slices for seed-based resting-state fMRI analysis results with SN as a priori seed (top), PD-ICA network from the PPMI data set (middle), ICA network consisting of white matter areas in basal ganglia and cerebellum (bottom).
(Selected slices in MNI space z = −2, x = −8, x = −23, y = 10). DOI: http://dx.doi.org/10.7554/eLife.08440.012
Figure 3—figure supplement 2.
Figure 3—figure supplement 2.. The correlation between the PD-ICA network and the 70 ICNs from Smith et al. (2009) is displayed in red.
The highest correlation ICN is depicted in Figure 3A. We generated random ICNs by reassigning the voxel coordinates of each of the 70 ICNs and measured the spatial correlation of each permutated ICN with the PD-ICA network. This was repeated 1000 times to generate a mean correlation and confidence interval, depicted in blue. DOI: http://dx.doi.org/10.7554/eLife.08440.013
Figure 3—figure supplement 3.
Figure 3—figure supplement 3.. Correspondence between the PD-ICA network and resting-state networks (RSN) from the Human Connectome Project (HCP).
We used the 100 component parcellation of RSNs available at db.humanconnectome.org (https://db.humanconnectome.org/megatrawl/index.html) generated using MELODIC software. The bottom left panel shows the overlap/similarity between the PD-ICA network and each of the 100 RSNs. The top 4 RSNs in terms of both correlation and Dice coefficient are displayed in the bottom right panel along with a hierarchical clustering of all 100 components (top panel) based on correlation of fMRI time series from each RSN. This shows that the four RSNs belong to the same cluster, supporting the notion that they form an intrinsically connected network. Moreover, permutation testing among the 100 RSNs demonstrated that the fMRI time series from the 4 RSNs of interest were significantly correlated with each other (p < 0.0016). DOI: http://dx.doi.org/10.7554/eLife.08440.014
Figure 4.
Figure 4.. Relationship between atrophy in different brain regions and functional and structural connectivity with SN.
The brain was parcellated into 112 regions (Figure 4—figure supplement 1). SN was chosen a priori as the region of interest, and the functional and structural connectivities between each given region and SN were calculated. The statistical difference (t-score) between the average deformation in PD and controls in each region was used as an atrophy measure. Using correlation, the relationship between regional atrophy and both regional functional connectivity with SN using resting-state fMRI (rsfMRI) (left) and regional anatomical distance using diffusion-weighted imaging (DW-MRI) (right) was examined. There was significantly greater atrophy with proximity to the SN determined functionally (r = 0.4, p < 0.0001) and anatomically (r = −0.28, p < 0.003). Note that the connectivity measure in rsfMRI is correlation, resulting in greater values for more connected regions, whereas the connectivity measure in DW-MRI is distance, resulting in smaller values for more connected regions. DOI: http://dx.doi.org/10.7554/eLife.08440.015
Figure 4—figure supplement 1.
Figure 4—figure supplement 1.. Anatomical atlas used for regional analysis.
DOI: http://dx.doi.org/10.7554/eLife.08440.018
Author response image 1.
DOI: http://dx.doi.org/10.7554/eLife.08440.023
Author response image 2.
DOI: http://dx.doi.org/10.7554/eLife.08440.024
Author response image 3.
DOI: http://dx.doi.org/10.7554/eLife.08440.025
Author response image 4.
DOI: http://dx.doi.org/10.7554/eLife.08440.026
Author response image 5.
DOI: http://dx.doi.org/10.7554/eLife.08440.027

Similar articles

Cited by

References

    1. Amunts K, Lepage C, Borgeat L, Mohlberg H, Dickscheid T, Rousseau MÉ, Bludau S, Bazin PL, Lewis LB, Oros-Peusquens AM, Shah NJ, Lippert T, Zilles K, Evans AC. BigBrain: an ultrahigh-resolution 3D human brain model. Science. 2013;340:1472–1475. doi: 10.1126/science.1235381. - DOI - PubMed
    1. Apostolova LG, Beyer M, Green AE, Hwang KS, Morra JH, Chou YY, Avedissian C, Aarsland D, Janvin CC, Larsen JP, Cummings JL, Thompson PM. Hippocampal, caudate, and ventricular changes in Parkinson's disease with and without dementia. Movement Disorders. 2010;25:687–695. doi: 10.1002/mds.22799. - DOI - PMC - PubMed
    1. Ashburner J, Friston KJ. Voxel-based morphometry—the methods. Neuroimage. 2000;11:805–821. doi: 10.1006/nimg.2000.0582. - DOI - PubMed
    1. Aubert-Broche B, Fonov VS, García-Lorenzo D, Mouiha A, Guizard N, Coupé P, Eskildsen SF, Collins DL. A new method for structural volume analysis of longitudinal brain MRI data and its application in studying the growth trajectories of anatomical brain structures in childhood. Neuroimage. 2013;82:393–402. doi: 10.1016/j.neuroimage.2013.05.065. - DOI - PubMed
    1. Bartra O, McGuire JT, Kable JW. The valuation system: a coordinate-based meta-analysis of BOLD fMRI experiments examining neural correlates of subjective value. Neuroimage. 2013;76:412–427. doi: 10.1016/j.neuroimage.2013.02.063. - DOI - PMC - PubMed

Publication types