. 2015 Oct;17(10):1259-1269.
doi: 10.1038/ncb3230. Epub 2015 Sep 7.

ATM functions at the peroxisome to induce pexophagy in response to ROS

Affiliations

ATM functions at the peroxisome to induce pexophagy in response to ROS

Jiangwei Zhang et al. Nat Cell Biol. 2015 Oct.

Abstract

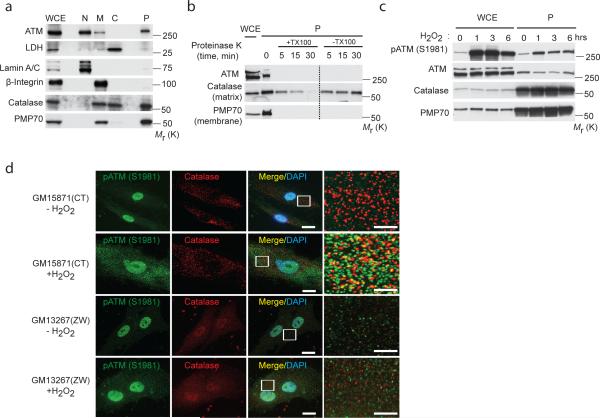
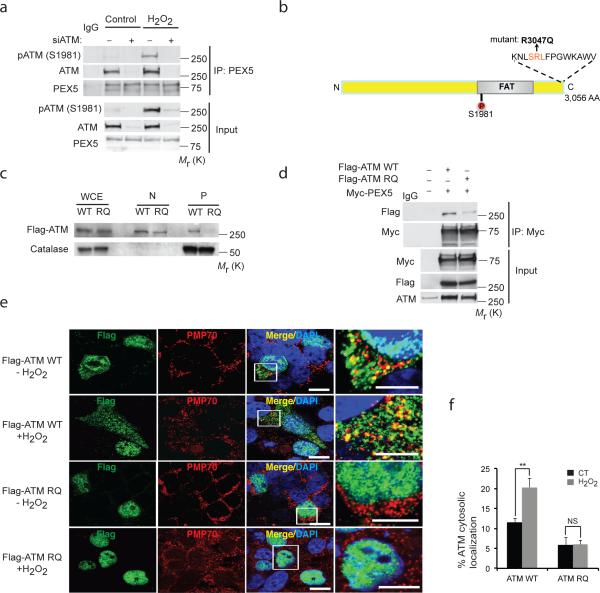
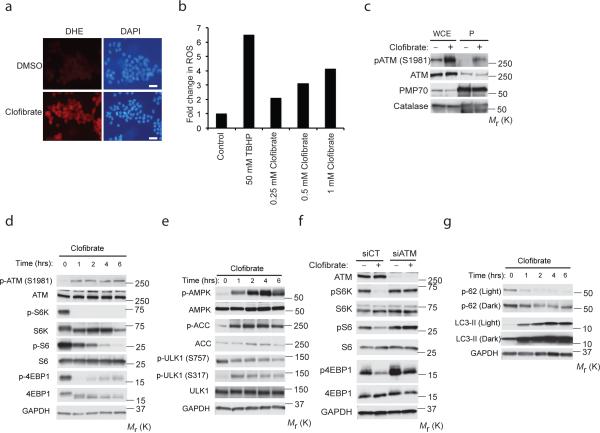
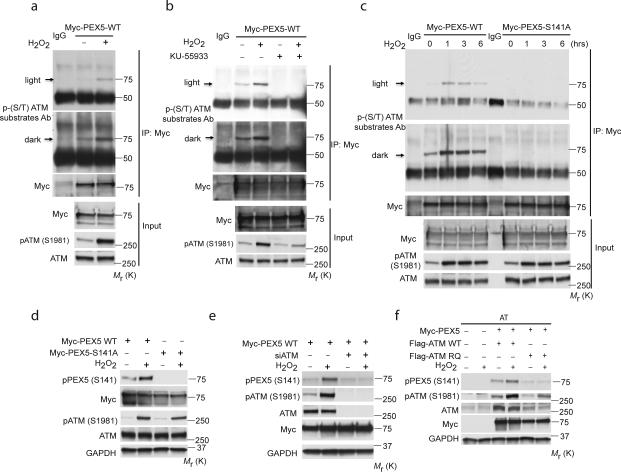
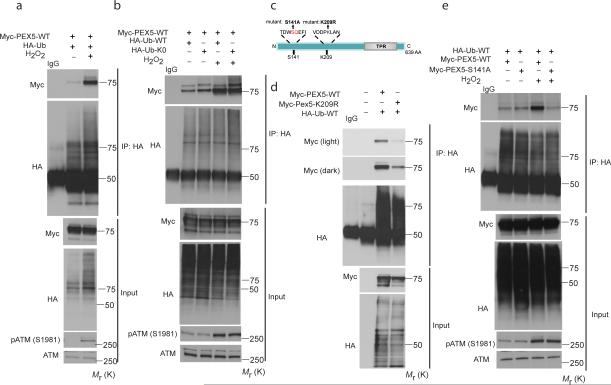
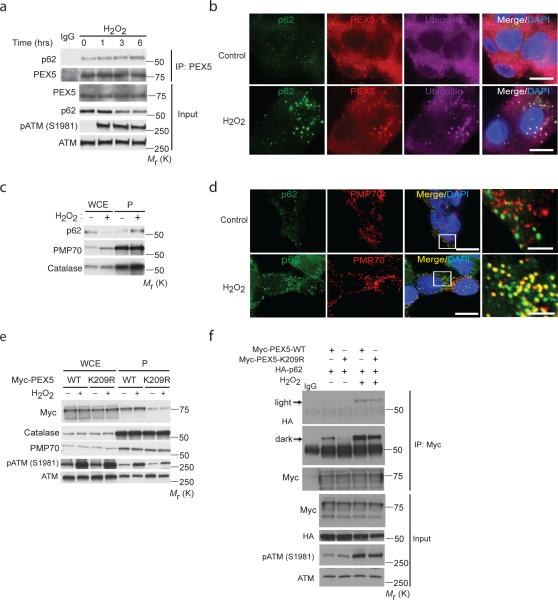
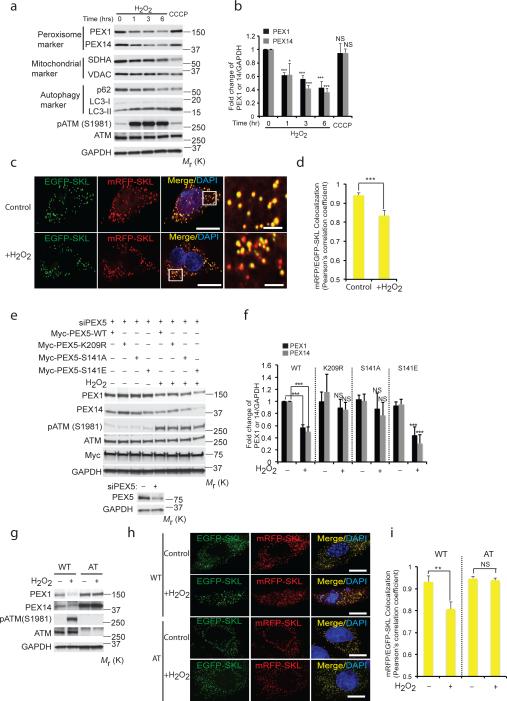
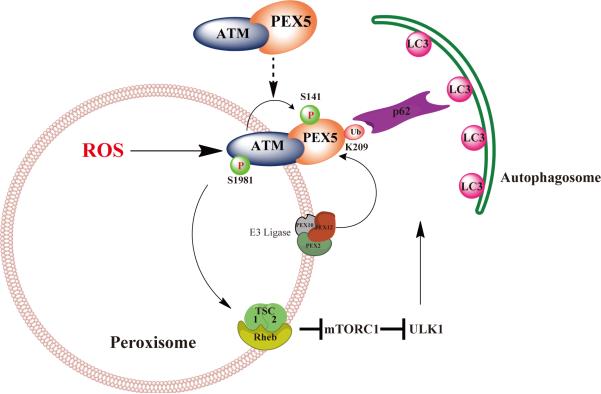
Peroxisomes are highly metabolic, autonomously replicating organelles that generate reactive oxygen species (ROS) as a by-product of fatty acid β-oxidation. Consequently, cells must maintain peroxisome homeostasis, or risk pathologies associated with too few peroxisomes, such as peroxisome biogenesis disorders, or too many peroxisomes, inducing oxidative damage and promoting diseases such as cancer. We report that the PEX5 peroxisome import receptor binds ataxia-telangiectasia mutated (ATM) and localizes this kinase to the peroxisome. In response to ROS, ATM signalling activates ULK1 and inhibits mTORC1 to induce autophagy. Specificity for autophagy of peroxisomes (pexophagy) is provided by ATM phosphorylation of PEX5 at Ser 141, which promotes PEX5 monoubiquitylation at Lys 209, and recognition of ubiquitylated PEX5 by the autophagy adaptor protein p62, directing the autophagosome to peroxisomes to induce pexophagy. These data reveal an important new role for ATM in metabolism as a sensor of ROS that regulates pexophagy.


Figures

Figure 1
Figure 1. ATM kinase is localized at peroxisome and activated in response to ROS
(a) Subcellular fractionation of HEK293 cells. Catalase and PMP70 were used as subcellular markers of the peroxisome (P). LDH, Lamin A/C and β-integrin were used as markers for cytosolic (C), nuclear (N) and membrane (M) fractions, respectively. WCE, whole cell extract. (b) Proteinase K assay in the presence or absence of Triton-X 100 performed with peroxisomal fractions obtained from HEK293 cells. Immunoblotting was performed with ATM, catalase and PMP70 antibodies. WCE, whole cell extract; P, peroxisome fraction. (c) HepG2 cells treated with H2O2 (0.4 mM) at 1, 3, 6 h. Whole cell extracts (WCE) and peroxisomal fractions (P) were probed with the indicated antibodies. (d) Representative image of wild type (GM15871) and Zellweger (GM13267) fibroblasts treated with or without H2O2 for 1 h and immunostained for active p-ATM (S1981) (green) and catalase (red). Scale bar, 15 μm. High-magnification images of boxed areas are indicated to the right (Scale bar, 5 μm). Uncropped images of western blots are shown in Supplementary Fig. S9.
Figure 2
Figure 2. PEX5 localizes ATM to the peroxisome
(a) Immunoprecipitation with anti-PEX5 antibody in HepG2 cells transfected with control or ATM siRNA and treated with H2O2 (0.4 mM) for 3 h followed by imunoblotting for endogenous ATM. Inputs were immunoblotted using the indicated antibodies. (b) Schematic indicating the putative PEX5 binding region - SRL sequence (amino acid 3046, 3047 and 3048) at the C terminus of ATM. (c) Subcellular fractionation of HEK293 cells overexpressing Flag-ATM WT or Flag-ATM RQ (mutant). Immunoblotting was performed with indicated anti-Flag and catalase antibodies. WCE, whole cell extract; N, Nuclear; P, peroxisome fraction. (d) Immunoprecipitation was performed with anti-Myc antibody in HEK293 cells overexpressing Myc-PEX5 with Flag-ATM WT or Flag-ATM RQ and immunoblotted with Flag. Inputs were immunoblotted using the indicated antibodies. (e) Representative image of HEK293 cells overexpressing either Flag-ATM WT or Flag-ATM RQ and treated with or without H2O2 (0.4 mM) for 1 h and immunostained for Flag (ATM-green) and PMP70 (Peroxisome-red). Scale bar, 10 μm. High-magnification images of boxed areas are shown to the right (Scale bar, 5 μm). (f) Quantification of the percentage of ATM localized to the cytosol from Fig. 2e was performed on n=3 independent experiment, 100 (ATM transfected) cells were analyzed in each experiment. All error bars represent s.d., ** P < 0.01 (student's t test). Uncropped images of western blots are shown in Supplementary Fig. S9, Statistic source data for Fig. 2f can be found in Supplementary Table 1.
Figure 3
Figure 3. Peroxisomal ROS activates ATM to repress mTORC1 and induce autophagy
(a) Representative images of FAO cells treated with vehicle (DMSO) or 0.25 mM clofibrate for 1 h, superoxide production was detected using dihydroethidium (DHE) staining. Scale bar, 30 μm. (b) Representative data of DCFDA assay from two independent experiments depicting the levels of ROS in FAO cells treated with clofibrate at the indicated doses for 1 h. Tert-butyl hydroperoxide (TBHP) 50 μM was used as a positive control for the assay. (c) ATM activation was monitored at the peroxisome in response to clofibrate at 3 h (1 mM) as indicated by western blot analysis of whole cell extract (WCE) and peroxisomal fractions (P) obtained from FAO cells. (d and e) FAO cells treated with 1 mM clofibrate for the indicated time points, activation of ATM-AMPK-TSC2 signaling and suppression of mTORC1 was monitored by western analysis for p-ATM (S1981), ATM, pS6K (T389), S6K, pS6 (S235/236), S6, p4E-BP1 (T37/46), 4E-BP1, pAMPK (T172), AMPK, pACC (S79), ACC, pULK1 (S757, mTORC1 site), pULK1 (S317, AMPK site), and ULK1. (f) Western analysis of HEK293 cells transfected with control or ATM siRNA and treated with 0.5 mM clofibrate for 6 h using anti-pS6K (T389), S6K, pS6 (S235/236), S6, p4E-BP1 (T37/46) and 4E-BP1 antibodies. (g) FAO cells treated with clofibrate (1mM) for indicated times. Induction of autophagy was monitored by western analysis of p62 and LC3-II. Uncropped images of western blots are shown in Supplementary Fig. S9, Source data for Fig. 3b can be found in Supplementary Table 1.
Figure 4
Figure 4. ATM phosphorylates PEX5 at S141 in response to ROS
(a) Immunoprecipitation of lysates from HEK293 cells overexpressing Myc-PEX5 and treated with H2O2 (0.4 mM) for 1 h, using an anti-Myc antibody followed by immunoblotting with a phospho-(S/T) ATM substrate antibody. Inputs were immunoblotted using the indicated antibodies. (b) Immunoprecipitation performed with anti-Myc antibody of lysates from HEK293 cells overexpressing Myc-PEX5, treated with H2O2 (0.4 mM) for 1 h in the presence/absence of an ATM inhibitor (KU-55933, 2 h pretreatment) followed by immunoblotting with phospho-(S/T) ATM substrate antibody. Inputs were immunoblotted using the indicated antibodies. (c) HEK293 cells transfected with either a Myc-PEX5-WT or Myc-PEX5-S141A mutant construct treated with H2O2 (0.4 mM) for the indicated times. Immunoprecipitation was performed with an anti-Myc antibody followed by immunoblotting with phospho-(S/T) ATM substrate antibody. Inputs were immunoblotted using the indicated antibodies. (d) HEK293 cells transfected with either a Myc-PEX5-WT or Myc-PEX5-S141A mutant construct treated with H2O2 (0.4 mM) for 1h. Western analysis was performed with anti- p-PEX5 (S141), Myc, p-ATM (S1981), ATM and GAPDH antibodies. (e) HEK293 cells transfected with Myc-PEX5-WT for 24 h following a siRNA knockdown of ATM for 48 h treated with H2O2 (0.4 mM) for 1h. Western analysis was performed with anti- p-PEX5 (S141) Myc, p-ATM (S1981), ATM and GAPDH antibodies. (f) AT (GM05849) fibroblast cells were transfected with Myc-Pex5 and Flag-ATM WT or Flag-ATM RQ mutant for 48 h and treated with H2O2 (0.4 mM) for 1h. Western analysis was performed with anti- p-PEX5 (S141) Myc, p-ATM (S1981), ATM and GAPDH antibodies. Uncropped images of western blots are shown in Supplementary Fig. S9.
Figure 5
Figure 5. S141 regulates PEX5 ubiquitination at K209 in response to ROS
(a) HEK293 cells expressing Myc-PEX5-WT and HA-Ub treated with H2O2 (0.4 mM) for 6 h, were co-immunoprecipitated using anti-HA and blotted using anti-Myc antibody. The inputs were immunoblotted using the indicated antibodies. (b) HEK293 cells expressing Myc-PEX5-WT and HAUb-WT or HA-Ub-K0 (ubiquitin with all lysine residues mutated to arginine) constructs were treated with H2O2 (0.4 mM) for 6 h, and Myc-PEX5 co-immunoprecipitated using anti-HA and blotted using anti-Myc antibody. Inputs were immunoblotted using the indicated antibodies. (c) Schematic representation of the N-terminus of PEX5 showing the putative ATM phosphorylation site (S141) and ubiquitination site (K209). (d) HEK293 cells expressing HA-Ub-WT and Myc-PEX5-WT or Myc-PEX5-K209R plasmids were treated with H2O2 (0.4 mM) for 6 h, and Myc-PEX5 coimmunoprecipitated using anti-HA antibody, and blotted using anti-Myc antibody. Input lysates were immunoblotted using the indicated antibodies. (e) HEK293 cells expressing HA-Ub-WT and Myc-PEX5-WT or Myc-PEX5-S141A constructs were treated with H2O2 (0.4 mM) for 6 h, and Myc-PEX5 co-immunoprecipitated using anti-HA antibody and blotted using anti-Myc antibody. Input lysates were immunoblotted using the indicated antibodies. Uncropped images of western blots are shown in Supplementary Fig. S9.
Figure 6
Figure 6. Ubiquitinated PEX5 binds with autophagy adaptor protein p62 in response to ROS
(a) HepG2 cells treated with H2O2 (0.4 mM) for the indicated time points were immunoprecipitated with anti-PEX5 and immunoblotted with anti-p62 antibodies. Inputs were immunoblotted using the indicated antibodies. (b) Representative image of HepG2 cells treated with H2O2 (0.4 mM) for 3h and immunostained with p62 (green) , PEX5 (red) and ubiquitin (purple). Scale bar, 10 μm. (c) Western analysis of whole cell extracts (WCE) and peroxisome fractions (P) of HepG2 cells treated with 0.4 mM of H2O2 for 1 h immunoblotted using anti-p62, anti-PMP70 and catalase antibodies. (d) Representative images of FAO cells treated with 0.4 mM of H2O2 for 1 h and immunostained with p62 (green) and PMP70 (peroxisomes-red). Scale bar, 10 μm. High-magnification images of boxed areas are shown to the right (Scale bar, 2.5 μm). (e) Subcellular fractionation of HEK293 cells overexpressing Myc-PEX5 WT or Myc-PEX5 K209R (mutant) treated with 0.4 mM of H2O2 for 3 h. Immunoblotting was performed with indicated anti-Myc, catalase, PMP70, phospho-ATM and ATM antibodies. WCE, whole cell extract; P, peroxisome fraction. (f) HEK293 cells transfected with HA-p62 and Myc-PEX5-WT or Myc-PEX5-K209R, and treated with 0.4 mM of H2O2 for 6h. Lysates were immunoprecipitated with anti-Myc and immunoblotted with anti-HA antibodies. Inputs were immunoblotted using the indicated antibodies. Uncropped images of western blots are shown in Supplementary Fig. S9.
Figure 7
Figure 7. Induction of pexophagy by ROS
(a) HepG2 cells treated with either H2O2 (0.4 mM) for indicated times or CCCP (50 μM, 6 h). Western analysis of peroxisome proteins PEX1 and PEX14 (SDHA and VDAC as mitochondrial markers, p62 and LC3-II as autophagy markers). (b) Quantification of PEX1 and PEX14 intensity normalized to GAPDH from Fig. 7a. (mean ± s.d., n = 3 independent experiments, student's t test). * P < 0.05 and *** P < 0.001, NS= not significant. (c) Representative images using HepG2 cells transfected with an mRFP-EGFP-SKL construct and treated with H2O2 for 6h. Scale bar, 10 μm. (d) Pearson's correlation coefficient for colocalization between mRFP-SKL and EGFP-SKL was calculated from Fig. 7c. n=4 independent experiment, 10 cells were analyzed in each experiments. All error bars represent s.d., (student's t test) *** P < 0.001. (e) HEK293 cells transfected with Myc-PEX5-WT or Myc-PEX5-K209R or Myc-PEX5-S141 for 24 h following prior siRNA knockdown of PEX5 for 48 h, treated with H2O2 (0.4 mM) for 6 h. Western analysis was performed using anti- PEX1, PEX14, phosphor-ATM (S1981), ATM, MYC and GAPDH antibodies. Corresponding immunoblots for HEK293 cells transfected with control or siRNA PEX5 showing levels of PEX5. (f) Quantification of PEX1 and PEX14 intensity normalized to GAPDH from Fig. 7e. (mean ± s.d., n = 4 independent experiments, student's t test). *** P < 0.001, NS= not significant. (g) WT (GM08399) and AT (GM05849) fibroblasts were treated with H2O2 (0.4 mM) for 6 h and immunoblotted with PEX1, PEX14, phospho-ATM, ATM and GAPDH antibodies. (h) Representative images using WT (GM08399) and AT (GM05849) fibroblasts transfected with a mRFP-EGFP-SKL construct and treated with H2O2 for 6h. Scale bar, 15 μm. (i) Pearson's correlation coefficient for colocalization between mRFP-SKL and EGFP-SKL was calculated from Fig. 7h. Quantification was performed from Fig S6a on n=3 independent experiments, 10 cells were analyzed in each experiment. All error bars represent s.d., (student's t test) ** P < 0.01, NS= not significant. Uncropped images of western blots are shown in Supplementary Fig. S9, Statistic source data for Fig. 7b,d,f and i can be found in Supplementary Table 1.
Figure 8
Figure 8
Working model for peroxisomal ATM signaling to the TSC signaling node to repress mTORC1, phosphorylation of PEX5 to induce ubiquitination by PEX2/10/12 E3 ligase, and recognition of Ub-PEX5 by p62 to induce pexophagy in response to ROS.

Comment in

  • A mammalian pexophagy target.
    Subramani S. Subramani S. Nat Cell Biol. 2015 Nov;17(11):1371-3. doi: 10.1038/ncb3253. Epub 2015 Oct 12. Nat Cell Biol. 2015. PMID: 26458245 Free PMC article.

Similar articles

Cited by

References

    1. Reddy JK, Hashimoto T. Peroxisomal beta-oxidation and peroxisome proliferator-activated receptor alpha: an adaptive metabolic system. Annual review of nutrition. 2001;21:193–230. - PubMed
    1. Schrader M, Fahimi HD. Peroxisomes and oxidative stress. Biochim Biophys Acta. 2006;1763:1755–1766. - PubMed
    1. Alexander A, et al. ATM signals to TSC2 in the cytoplasm to regulate mTORC1 in response to ROS. Proc Natl Acad Sci U S A. 2010;107:4153–4158. - PMC - PubMed
    1. Chen Y, Azad MB, Gibson SB. Superoxide is the major reactive oxygen species regulating autophagy. Cell Death Differ. 2009;16:1040–1052. - PubMed
    1. Holmstrom KM, Finkel T. Cellular mechanisms and physiological consequences of redox-dependent signalling. Nature reviews. Molecular cell biology. 2014;15:411–421. - PubMed

Publication types

MeSH terms