Review
. 2016 Mar:51:90-106.
doi: 10.1016/j.preteyeres.2015.09.001. Epub 2015 Sep 4.

MRI of rod cell compartment-specific function in disease and treatment in vivo

Affiliations
Review

MRI of rod cell compartment-specific function in disease and treatment in vivo

Bruce A Berkowitz et al. Prog Retin Eye Res. 2016 Mar.

Abstract

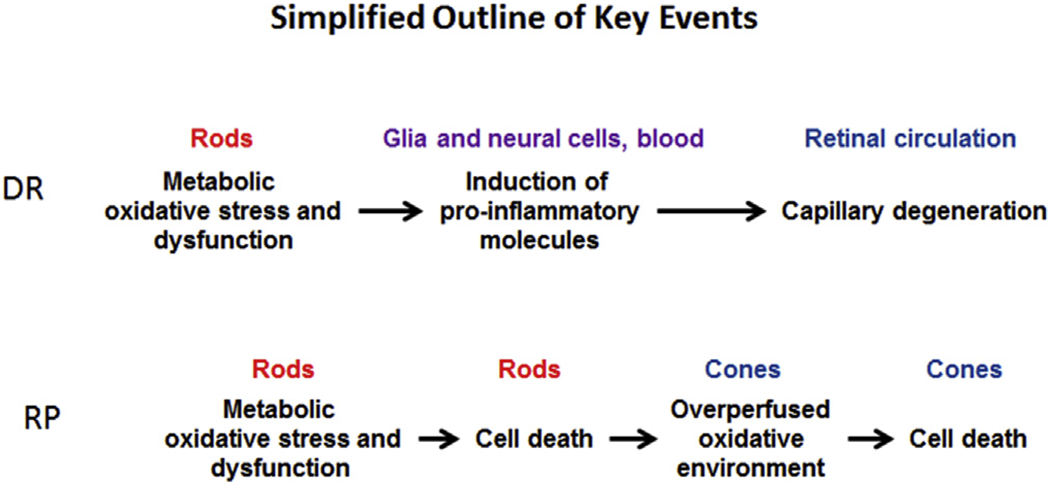
Rod cell oxidative stress is a major pathogenic factor in retinal disease, such as diabetic retinopathy (DR) and retinitis pigmentosa (RP). Personalized, non-destructive, and targeted treatment for these diseases remains elusive since current imaging methods cannot analytically measure treatment efficacy against rod cell compartment-specific oxidative stress in vivo. Over the last decade, novel MRI-based approaches that address this technology gap have been developed. This review summarizes progress in the development of MRI since 2006 that enables earlier evaluation of the impact of disease on rod cell compartment-specific function and the efficacy of anti-oxidant treatment than is currently possible with other methods. Most of the new assays of rod cell compartment-specific function are based on endogenous contrast mechanisms, and this is expected to facilitate their translation into patients with DR and RP, and other oxidative stress-based retinal diseases.

Keywords: Animal models; Calcium channels; Diabetes; MRI; Retinitis pigmentosa; Retinopathy; Subretinal space; Vision.


Figures

Fig. 1.
Fig. 1.
Simplified representation of key events in DR and RP over time; DR and RP time courses are not to scale and are not comparable. The key point here is that rod cell metabolic oxidative stress and dysfunction – either from a metabolic disturbance (DR) or genetic abnormality (RP) – are important early events.
Fig. 2.
Fig. 2.
Representative MRI images (axial resolution 23.4 μm) of three common laboratory models acquired using established protocols (Berkowitz et al., 2014; Bissig et al., 2013); the images are proportionately sized based on ocular anatomy.
Fig. 3.
Fig. 3.
Simplified illustration of the rod cell functionome (white boxes in center) in dark (left) and light (right) as assessed by multi-functional MRI metrics. The array of essential information measured by MRI (shown in the white boxes) is unavailable from other imaging methods. Inner retinal circulatory plexi are not shown. Drawing courtesy of Jawan Gorgris.
Fig. 4.
Fig. 4.
Summary of multi-functional MRI (graphs) spatially registered to OCT (top image, left). Rod functions in dark (black line) vs. light (pink line) in non-diabetic (left column) and diabetic (right column) mice. In summary, diabetes impairs light-evoked functions (except arrestin1 and its translocation) and these abnormalities were correctable with antioxidant treatments (Table 1). N’s for the dark and light data, respectively, are as follows: LTCC graphs (wt: 19 and 11, diabetic: 6 and 7); Sub-retina space graphs: (wt: 23 and 23, diabetic: 9 and 9); 1/T1ρ graphs (wt: 7 and 7, diabetic: 5 and 5). Light-evoked choroidal expansion is maintained in diabetics but to a significantly reduced degree (bargraph, paired dark/light data, n = 18 (wt) and 9 (diabetic)); an antioxidant did not correct this abnormality. *, P < 0.05. Data for each graph is obtained from central (+/− 0.4 − 1 mm from the optic nerve head) retina and shown as a function of distance from retina/non-retina borders, where 0% is the vitreous/retina border and 100% is the retina/choroid border. Above graphs: simplified schematic of retina and support circulations (Paques et al., 2003;Wangsa-Wirawan and Linsenmeier, 2003; Zhi et al., 2014). Red horizontal bracket and star above profiles indicates specific retinal regions with significant (P < 0.05) light-evoked differences. Based on OCT data (Fig. 4), vertical dashed lines approximate layer locations in retina.
Fig. 5.
Fig. 5.
Cartoon summarizing impact of rod cell membrane hyperpolarization in the light (left) and depolarization in the dark (right) on influx of manganese.
Fig. 6.
Fig. 6.
Functional LTCC topography as measured by MEMRI in dark and light adaptation. (A) Data for C57Bl/6 mice (wt); graph and graphing conventions are as in Fig. 4. B) and C) illustrate how manganese uptake in inner retina (0–50% depth) or outer retina (50–100% depth), as measured using T1 weighted MRI, response to changes in light intensity, respectively, in male albino control Sprague—Dawley rats after exposure to the following light intensities: 1.8 ± 0.7 (n = 10, mean ± SEM), 51.3 ± 11.7 (n = 5), and 250.2 ± 19.3 (n = 6) lux. (Berkowitz et al., 2009a). In C), the red line indicates a significant (P < 0.05) linear correlation. *, P < 0.05.
Fig. 7.
Fig. 7.
Functional LTCC topography as measured by MEMRI in dark adapted wt mice (n = 6) or 6 week old rd12 mice (n = 7); graphing conventions are as in Fig. 4. *, P < 0.05.
Fig. 8.
Fig. 8.
Functional LTCC topography as measured by MEMRI in dark adapted wt mice (closed black circles, n = 19), Cav1.4−/− mice (closed gold circle, n = 5), and cx57−/− mice (closed blue circle, n = 5). Graphing conventions are as in Fig. 4 (Berkowitz et al., 2015b). *, P < 0.05.
Fig. 9.
Fig. 9.
Functional LTCC topography as measured by MEMRI in dark adapted wt mice (n = 19) or cx36−/− mice (n = 5); graphing conventions are as in Fig. 4. *, P < 0.05.
Fig. 10.
Fig. 10.
Representative maps of tissue R1 (in units of s−1) from baseline (no Mn2+, left half of each composite image) and Mn2+-injected long Evans rats (right half of each composite image) (Bissig et al., 2013). In Mn2+-injected rats, R1 — which is linearly related to tissue Mn2+ concentration (Chuang et al., 2009) — increases with age; this change was not linked with blood–retinal barrier breakdown (Bissig et al., 2013). In addition, the no-manganese baseline R1s were stable over time (Bissig et al., 2013).
Fig. 11.
Fig. 11.
Light detection using ADC MRI. A) Summary of central retinal ADC with retinal depth during dark (closed symbols, n = 23) and light (open symbols, n = 23) in untreated mice (WT). Approximate location of retinal layers is indicated (dotted blue lines and insert cartoon). Profiles are spatially normalized to retinal thickness (0% = vitreous/retina border, 100% = vitreous/choroid border). Red bracket/horizontal line, P < 0.05. B) Summary of paired data (filled = dark, open = light) of WT (n = 23), MnCl2-treated mice (WT + Mn, n = 6), GNAT1−/− mice (n = 6), untreated + vehicle treated diabetic mice (STZ, n = 9), diabetic mice treated acutely with the anti-oxidant a-lipoic acid (STZ + LPA, n = 8), on-diabetic acetazolamide-treated mice (AZM, n = 8) (Berkowitz et al., 2015a).

Similar articles

Cited by

References

    1. Adijanto J, Banzon T, Jalickee S, Wang NS, Miller SS, 2009. CO2-induced ion and fluid transport in human retinal pigment epithelium. J. General Physiol 133, 603–622. - PMC - PubMed
    1. Alder VA, Yu DY, Cringle SJ, Su EN, 1991. Changes in vitreal oxygen tension distribution in the streptozotocin diabetic rat. Diabetologia 34, 469–476. - PubMed
    1. Antonetti DA, Barber AJ, Khin S, Lieth E, Tarbell JM, Gardner TW, 1998. Vascular permeability in experimental diabetes is associated with reduced endothelial occludin content: vascular endothelial growth factor decreases occludin in retinal endothelial cells. Penn State Retina Research Group. Diabetes 47, 1953–1959. - PubMed
    1. Arteel GE, Thurman RG, Raleigh JA, 1998. Reductive metabolism of the hypoxia marker pimonidazole is regulated by oxygen tension independent of the pyridine nucleotide redox state. Eur. J. Biochem 253, 743–750. - PubMed
    1. Asteriti S, Gargini C, Cangiano L, 2014. Mouse rods signal through gap junctions with cones. Elife 3, e01386. - PMC - PubMed

Publication types

MeSH terms