. 2015 Nov 15:90:28-38.
doi: 10.1016/j.ymeth.2015.09.004. Epub 2015 Sep 3.

Use of genetically-encoded calcium indicators for live cell calcium imaging and localization in virus-infected cells

Affiliations

Use of genetically-encoded calcium indicators for live cell calcium imaging and localization in virus-infected cells

Jacob L Perry et al. Methods. .

Abstract

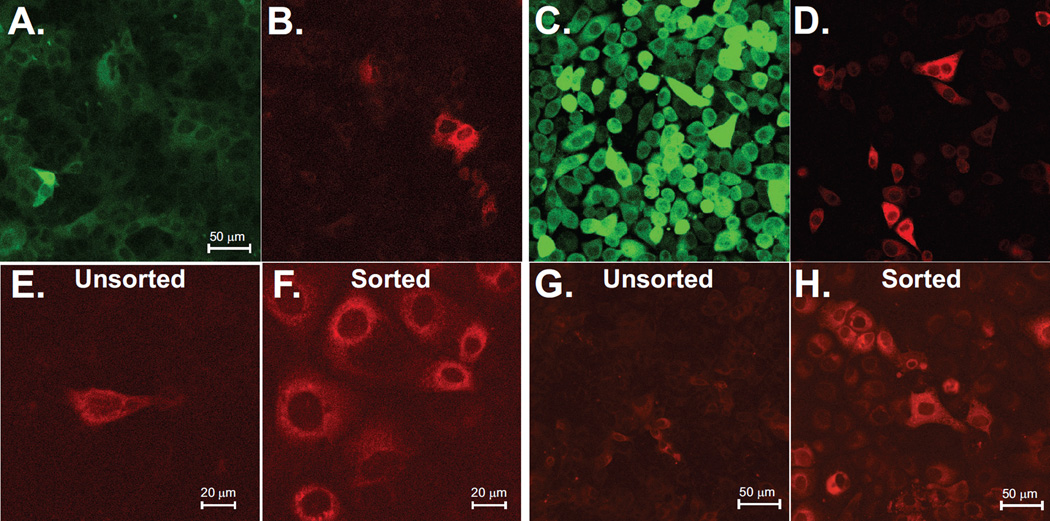
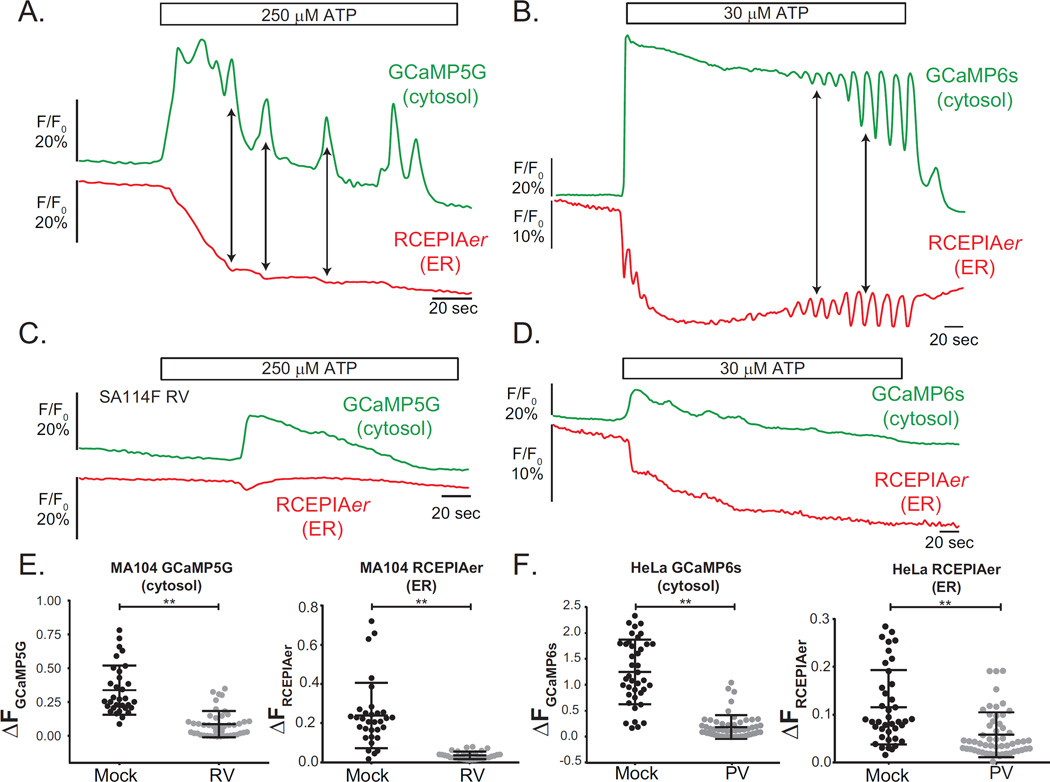
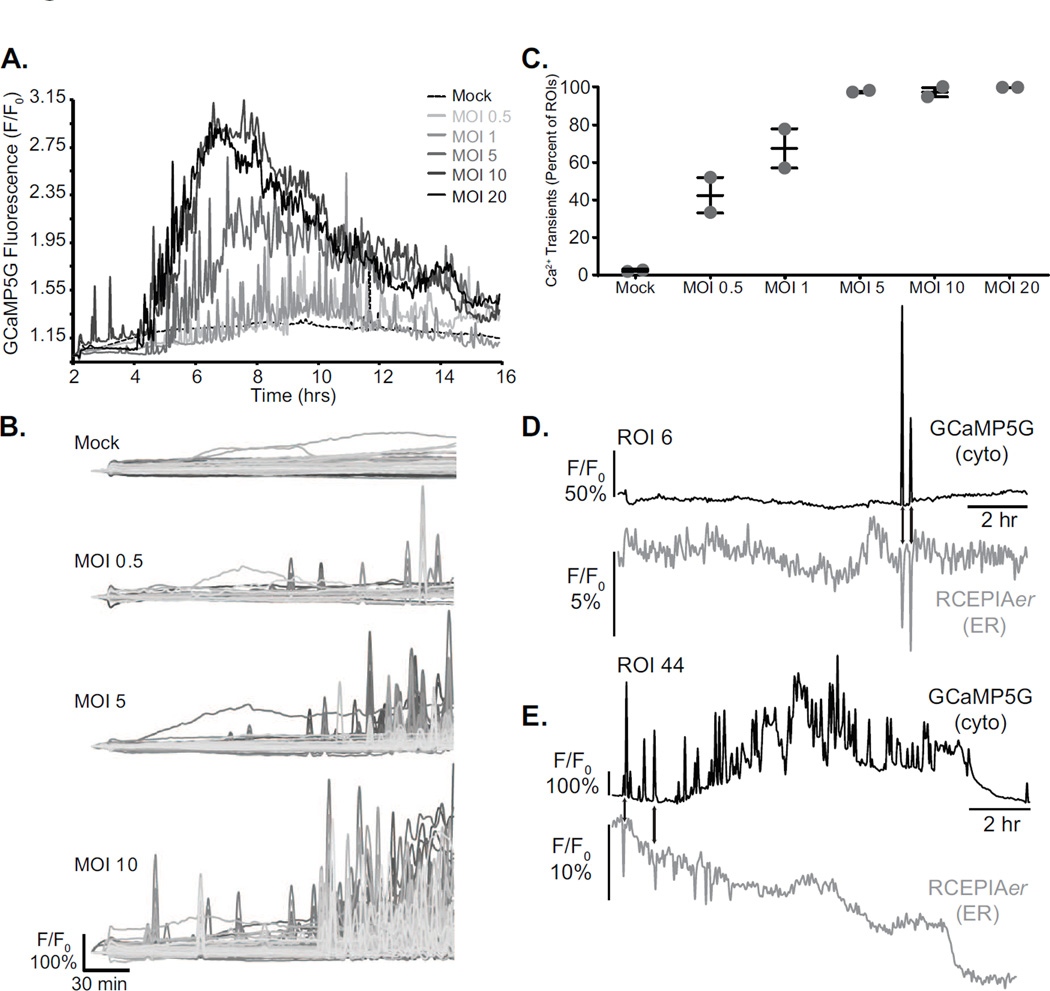
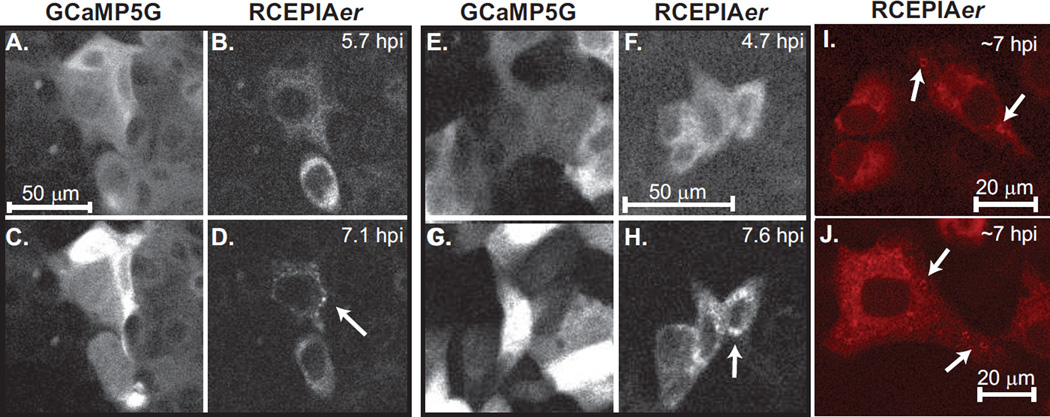
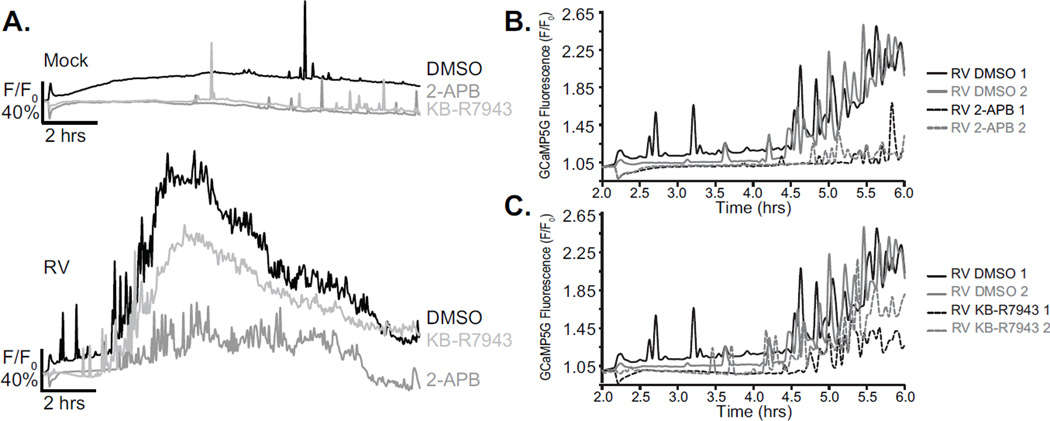
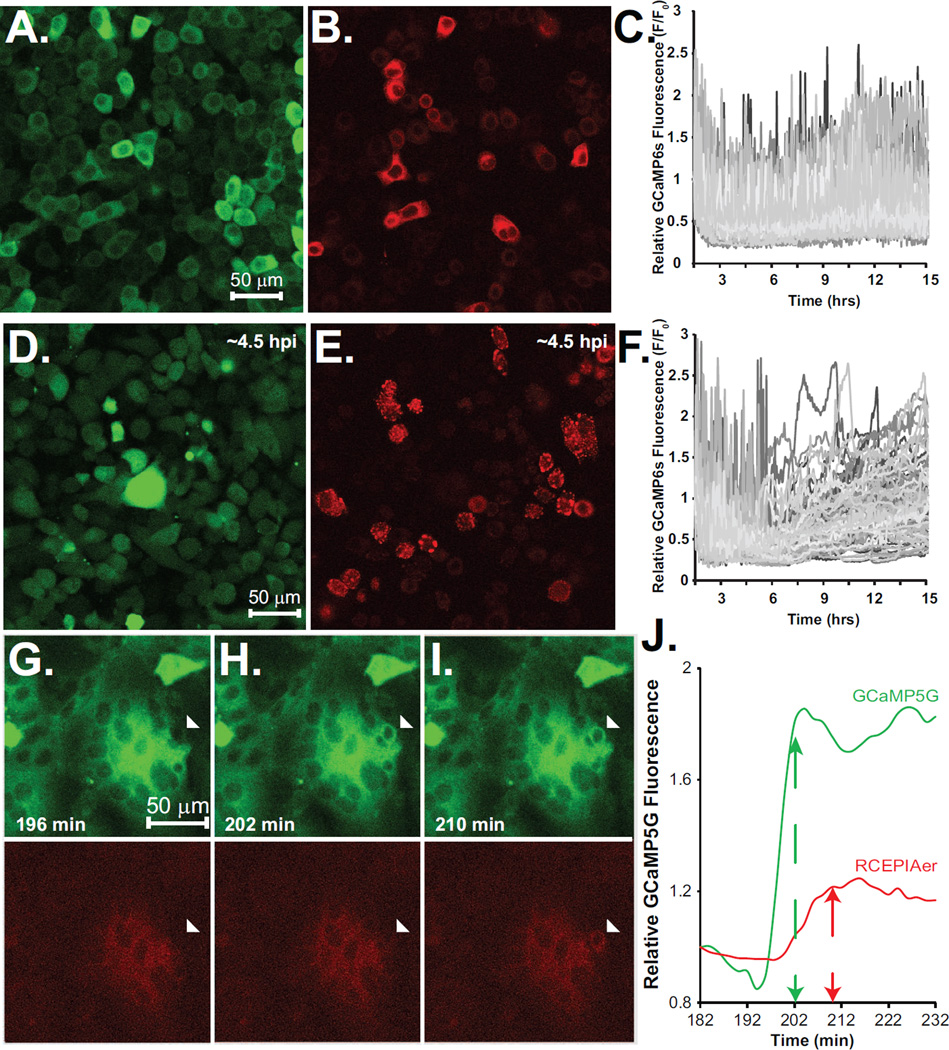
Calcium signaling is a ubiquitous and versatile process involved in nearly every cellular process, and exploitation of host calcium signals is a common strategy used by viruses to facilitate replication and cause disease. Small molecule fluorescent calcium dyes have been used by many to examine changes in host cell calcium signaling and calcium channel activation during virus infections, but disadvantages of these dyes, including poor loading and poor long-term retention, complicate analysis of calcium imaging in virus-infected cells due to changes in cell physiology and membrane integrity. The recent expansion of genetically-encoded calcium indicators (GECIs), including blue and red-shifted color variants and variants with calcium affinities appropriate for calcium storage organelles like the endoplasmic reticulum (ER), make the use of GECIs an attractive alternative for calcium imaging in the context of virus infections. Here we describe the development and testing of cell lines stably expressing both green cytoplasmic (GCaMP5G and GCaMP6s) and red ER-targeted (RCEPIAer) GECIs. Using three viruses (rotavirus, poliovirus and respiratory syncytial virus) previously shown to disrupt host calcium homeostasis, we show the GECI cell lines can be used to detect simultaneous cytoplasmic and ER calcium signals. Further, we demonstrate the GECI expression has sufficient stability to enable long-term confocal imaging of both cytoplasmic and ER calcium during the course of virus infections.

Keywords: Endoplasmic reticulum; Enterovirus; GCaMP5G; GCaMP6s; RCEPIAer; Respiratory syncytial virus; Rotavirus.


Figures

Figure 1
Figure 1. Stable GECI cell lines
Confocal microscopy of the established MA104 (A & B) and HeLa (C & D) cell lines for basal GCaMP5G (A), GCaMP6s (C) and RCEPIAer (B & D). Enrichment in RCEPIAer expressing cells by FACS is shown for unsorted (E) and sorted (F) cells. RCEPIAer signal was also improved using a wider filter emission range (605–745 nm) in both the unsorted (G) and sorted (H) cells.
Figure 2
Figure 2. Evaluation of cytoplasmic and endoplasmic reticulum Ca2+ responses in virus-infected GECI-expressing cells
A–D. MA104-GCaMP5G/RCEPIAer (A & C) or HeLa-GCaMP6s/RCEPIAer (B & D) were mock treated (A & B) or infected with RV (C) or PV (D). Cells were perfused with FluoroBrite DMEM and then treated with ATP for ~150 sec. Cytoplasmic Ca2+ increases paired with co-incident ER Ca2+ decreases are indicated by arrows. E. Relative change in GCaMP5G (left) or RCEPIAer (right) fluorescence after 250 µM ATP stimulation in mock (N=34) or RV-infected (N=44) cells showed delayed and reduced ATP responses in RV-infected cells. F. Relative change in GCaMP6s (left) or RCEPIAer (right) fluorescence after 30 µM ATP stimulation in mock (N=40) or PV-infected (N=56) showed reduced and dysregulated ATP-induced oscillations in PV-infected cells. **P < 0.0001. Each experiment was performed in triplicate with 3 replicates per condition.
Figure 3
Figure 3. Long-term live cell Ca2+ imaging during rotavirus infection
A. Relative GCaMP5G fluorescence of RV-infected MA104 cells from ~2–14 hpi. Cells were infected with the indicated MOI in duplicate. Traces represent the average fluorescence intensity from the field of view of one of the two wells. B. The GCaMP5G fluorescence intensity from 2–6 hpi of mock treated cells (top), or cells infected with different MOIs (as indicated) were analyzed using a 10×10 ROI array. Ca2+ transients are observed as spikes in the individual traces. C. The percent of ROIs from the 10×10 array analyses in panel B are graphed as a function of the MOI. Values are shown with the mean +/− the standard error of the mean. D. Relative GECI fluorescence of concomitant cytoplasmic/ER Ca2+ transients in mock (D) or RV-infected (E) MA104 cells detected with GCaMP5G (black line) and RCEPIAer (grey line), respectively. Data are representative of two experiments with at least two replicates per MOI in each experiment.
Figure 4
Figure 4. Changes in RCEPIAer localization during rotavirus infection
Examples (A–D and E–H) of RCEPIAer redistribution into discrete puncta during the long-term imaging of RV infection. The images were taken during the long-term confocal microscopy runs. GCaMP5G (A & C, E & G) shows the increase in fluorescence as the infection progresses. RCEPIAer signal is diffuse in the ER at 5–6 hpi (B and F) but moves into discrete puncta structures (D and H, arrows) by 7–8 hpi. RV-induced puncta were observed as ring-like structures at ~7 hpi in the sorted MA104 GCaMP5G/RCEPIAer cells (I & J, arrows).
Figure 5
Figure 5. Calcium channel blockers reduce rotavirus-induced Ca2+ signals
A. Average traces from a representative well for mock (top) or RV-infected (bottom) cells treated with DMSO (black), 2-APB (dark grey), and KB-R7943 (light grey). B–C. RV-induced Ca2+ transients were measured by plotting the relative GCaMP5G fluorescence from RV-infected (2–6 hpi) cells mock treated (solid lines) or treated with 50 µM 2-APB (B, dashed lines) or 10 µM KB-R7943 (C, dashed lines). Each experiment was performed at least 2 times with 2–3 replicates per drug treatment.
Figure 6
Figure 6. Long-term Ca2+ imaging of poliovirus and respiratory syncytial virus-infected cells
A–E. Confocal images of mock (A–B) or poliovirus-infected (D–E) HeLa-GCaMP6s/RCEPIAer cells. Cytoplasmic GCaMP6s (A and D) and ER-localized RCEPIAer (B–E). A 10×10 ROI array was used to examine relative GCaMP6s changes for [Ca2+]c in mock (C) and PV-infected (F) cells. G–I. Sequence of confocal images of RSV-infected MA104-GCaMP5G/RCEPIAer cells highlighting a cell fusion event (arrow head). J. Analysis of the cell fusion illustrating a spike in [Ca2+]c (GCaMP5G, green) precedes the elevation in [Ca2+]ER (RCEPIAer, red). Each long-term imaging experiment was performed twice with at least 3 replicates per infection.

Similar articles

Cited by

References

    1. Berridge MJ, Lipp P, Bootman MD. The versatility and universality of calcium signalling. Nat. Rev. Mol. Cell Biol. 2000;1:11–21. doi:10.1038/35036035 [doi];35036035 [pii] - PubMed
    1. Ruiz MC, Cohen J, Michelangeli F. Role of Ca2+in the replication and pathogenesis of rotavirus and other viral infections. Cell Calcium. 2000;28:137–149. - PubMed
    1. Chami M, Oules B, Paterlini-Brechot P. Cytobiological consequences of calcium-signaling alterations induced by human viral proteins. Biochim. Biophys Acta. 2006;1763:1344–1362. - PubMed
    1. Zhou Y, Frey TK, Yang JJ. Viral calciomics: interplays between Ca2+ and virus. Cell Calcium. 2009;46:1–17. - PMC - PubMed
    1. Michelangeli F, Ruiz MC, del Castillo JR, Ludert JE, Liprandi F. Effect of rotavirus infection on intracellular calcium homeostasis in cultured cells. Virology. 1991;181:520–527. - PubMed

Publication types

LinkOut - more resources