. 2015 Sep 22;12(11):1915-26.
doi: 10.1016/j.celrep.2015.08.015. Epub 2015 Sep 3.

Mutational Analysis of Ionizing Radiation Induced Neoplasms

Affiliations

Mutational Analysis of Ionizing Radiation Induced Neoplasms

Amy L Sherborne et al. Cell Rep. .

Abstract

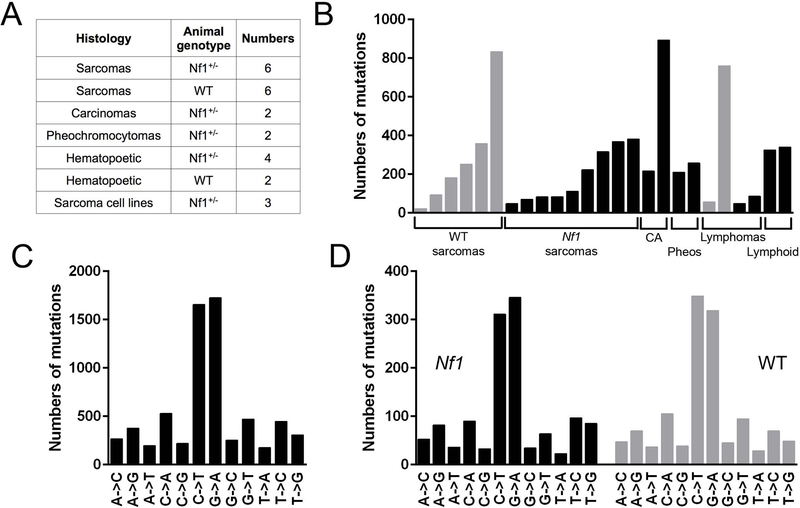
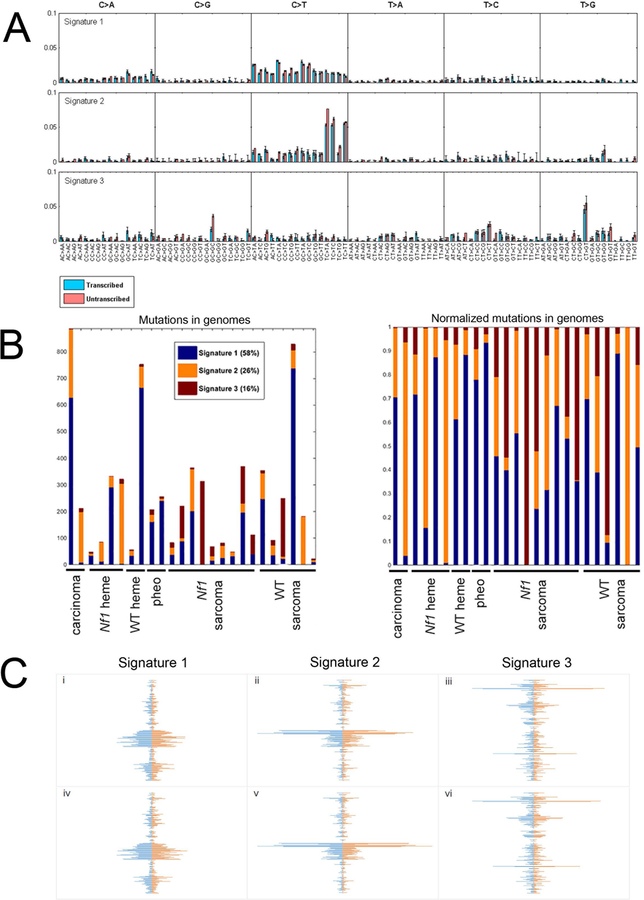
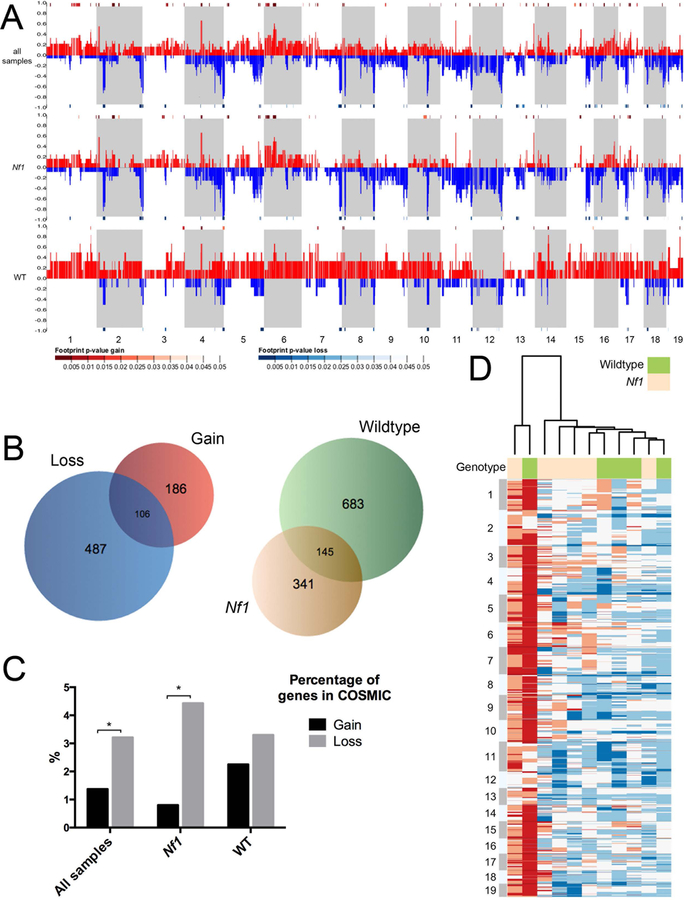
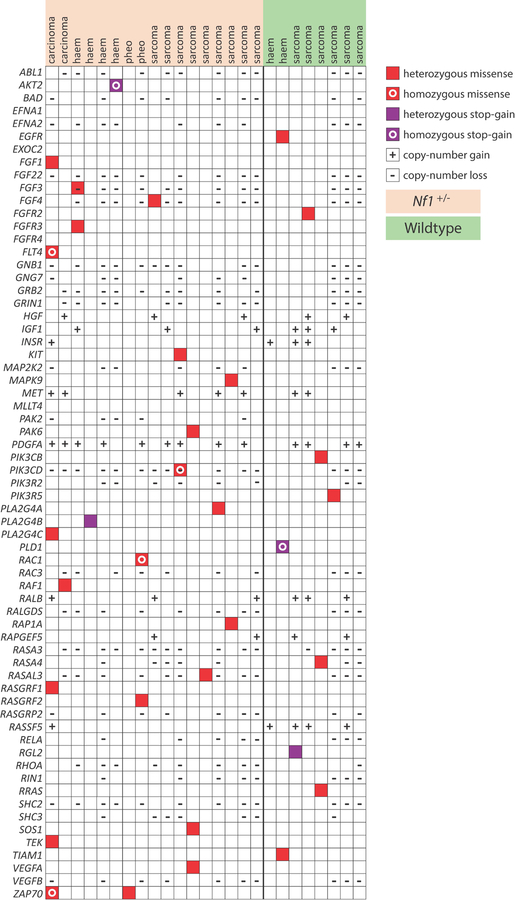
Ionizing radiation (IR) is a mutagen that promotes tumorigenesis in multiple exposure contexts. One severe consequence of IR is the development of second malignant neoplasms (SMNs), a radiotherapy-associated complication in survivors of cancers, particularly pediatric cancers. SMN genomes are poorly characterized, and the influence of genetic background on genotoxin-induced mutations has not been examined. Using our mouse models of SMNs, we performed whole exome sequencing of neoplasms induced by fractionated IR in wild-type and Nf1 mutant mice. Using non-negative matrix factorization, we identified mutational signatures that did not segregate by genetic background or histology. Copy-number analysis revealed recurrent chromosomal alterations and differences in copy number that were background dependent. Pathway analysis identified enrichment of non-synonymous variants in genes responsible for cell assembly and organization, cell morphology, and cell function and maintenance. In this model system, ionizing radiation and Nf1 heterozygosity each exerted distinct influences on the mutational landscape.


Figures

Figure 1.
Figure 1.. Numbers and types of substitutions in sequenced samples
Summary of tumors sequenced and the frequencies of mutations seen. A. Types and numbers of primary radiation-induced malignancies from wildtype and Nf1 mutant mice that were analyzed by whole exome sequencing. B. Synonymous and non-synonymous SNVs in each sample, malignancies from Nf1 mutant mice in black, wildtype in grey (CA – carcinomas, Pheos – Pheochromocytomas, Lymphoid – Lymphoid malignancies). C. Frequencies of specific types of base substitutions in SNVs pooled from all samples. D. Composition of SNVs in Nf1 mutant and wildtype sarcomas, corrected for total number of mutations. See also Tables S1–4.
Figure 2.
Figure 2.. Mutation signature analysis
Mutation signature analysis was performed on non-synonymous and synonymous substitutions in 25 samples. A. Three discrete mutational signatures were identified. The plots show the distribution of the 6 mutation types defined by the pyrimidine base in each signature, as inferred from the NMF procedure. Each sub-graph within a signature represents one substitution (e.g., A→C when A in the reference genome is mutated to C in the sample). The bars within each sub-graph include the nucleotides in the reference genome on either side of the mutation location. All trinucleotide combinations are subdivided as to whether the pyrimidine is on the transcribed (blue) or untranscribed (pink) strand. B. The distribution of each of the three signatures in each of the 25 radiation-induced tumors is shown. The left panel plots the numbers of substitutions comprising each signature. The right panel displays a normalized plot. C. Spindle plots depict the similarity of signatures derived from different subsets of the data. Horizontal lines indicate the coefficients for 192 mutation types (including substitution based on pyrimidine reference, strand and flanking nucleotides) of the three signatures, sorted from bottom to top in the same order as panel A is sorted left to right. All 3 panels have the same 3 figures on the left, 3 signatures extracted from 25 samples using both synonymous and non-synonymous mutations. i-iii compare the three signatures extracted using both synonymous and non-synonymous SNVs (left, blue) versus signatures extracted using only non-synonymous SNVs (right, red). iv-vi compare the three signatures for non-synonymous and synonymous SNVs using 25 samples (left, blue) versus the three signatures for non-synonymous and synonymous SNVs in 22 samples (excluding the three most mutated samples)(right, red). See also Figures S1 and S2, and Tables S5–7.
Figure 3.
Figure 3.. Copy number alteration shared between WT and Nf1 mutant backgrounds.
Control-FREEC software was used to compare read numbers between tumors and germline control in order to estimate copy number alterations in tumors. A. Genome-wide copy number alterations in all malignancies (top row), Nf1 tumors alone (middle row) and wildtype tumors alone (bottom row). Alternating stripes indicate consecutive chromosomes, beginning with chromosome 1 at the far left. The proportion of samples showing gain is displayed in red, and loss in blue. Significantly altered areas, as calculated using STAC (Diskin et al., 2006),are indicated by heatmap bars directly above the chromosomal area for gain, and below for loss (p < 0.05 shown). Overall, Nf1 mutant-derived samples showed far more copy number losses than gains (23% versus 8%), while wildtype-derived tumors showed the opposite pattern, demonstrating fewer losses than gains (9% versus 29%). B. Unsupervised hierarchical clustering analysis was performed on copy number variation (CNV) data to organize sarcomas from wildtype and Nf1 mutant mice into groups sharing similar patterns of copy number alterations. The heatmap shows CNVs smoothed into 15 kb windows with white indicating normal copy number, blue indicating loss and red indicating gain. See also Tables S8 and S9. C. Venn diagrams depicting: left, the numbers of genes affected by significant copy number change that are gained in all sarcomas (red), lost in all sarcomas (blue), or both (intersection); right, the numbers of genes affected by significant copy number change that are altered in Nf1 sarcomas (tan), wildtype sarcomas (green), or altered in both (intersection). D. Bar graph displays the percentage of genes in the COSMIC database that are involved by either copy number gain or loss in all sarcomas (left), Nf1 mutant sarcomas (middle), or wildtype sarcomas (right). Student’s t-test, *p < 0.05.
Figure 4.
Figure 4.. Ras pathway genes mutated in IR-induced malignancies
The table displays Ras pathway genes that demonstrate significant copy-number changes (either loss or gain), missense mutations, and/or stop-gain mutations in IR-induced neoplasms.

References

    1. Alexandrov LB, Nik-Zainal S, Wedge DC, Aparicio SA, Behjati S, Biankin AV, Bignell GR, Bolli N, Borg A, Borresen-Dale AL, et al. (2013a). Signatures of mutational processes in human cancer. Nature 500, 415–421. - PMC - PubMed
    1. Alexandrov LB, Nik-Zainal S, Wedge DC, Campbell PJ, and Stratton MR. (2013b). Deciphering signatures of mutational processes operative in human cancer. Cell reports 3, 246–259. - PMC - PubMed
    1. Armstrong GT, Liu Q, Yasui Y, Huang S, Ness KK, Leisenring W, Hudson MM, Donaldson SS, King AA, Stovall M, et al. (2009a). Long-term outcomes among adult survivors of childhood central nervous system malignancies in the Childhood Cancer Survivor Study. J Natl Cancer Inst 101, 946–958. - PMC - PubMed
    1. Armstrong GT, Liu Q, Yasui Y, Neglia JP, Leisenring W, Robison LL, and Mertens AC. (2009b). Late mortality among 5-year survivors of childhood cancer: a summary from the Childhood Cancer Survivor Study. J Clin Oncol 27, 2328–2338. - PMC - PubMed
    1. Bhatia S, and Sklar C. (2002). Second cancers in survivors of childhood cancer. Nat Rev Cancer 2, 124–132. - PubMed

Publication types