. 2015 Sep 8:6:8161.
doi: 10.1038/ncomms9161.

A quantitative description of Ndc80 complex linkage to human kinetochores

Affiliations

A quantitative description of Ndc80 complex linkage to human kinetochores

Aussie Suzuki et al. Nat Commun. .

Abstract

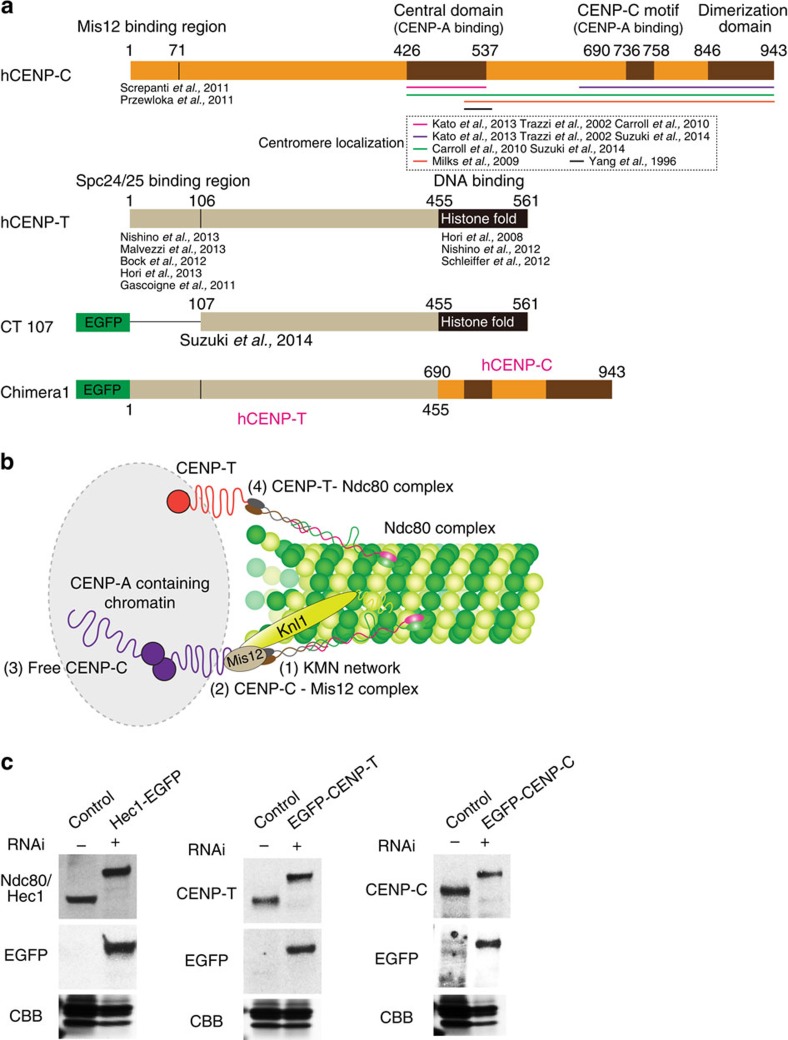
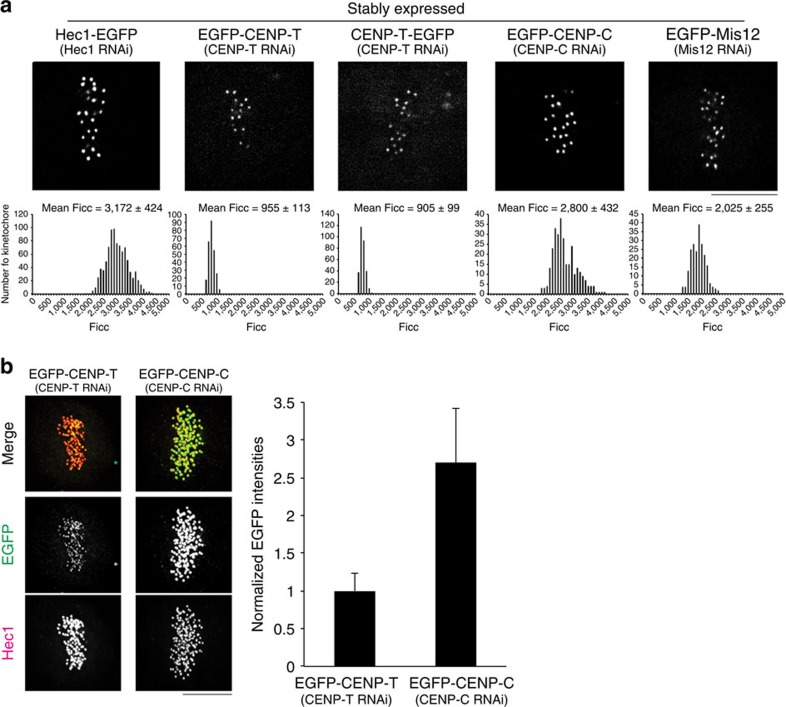
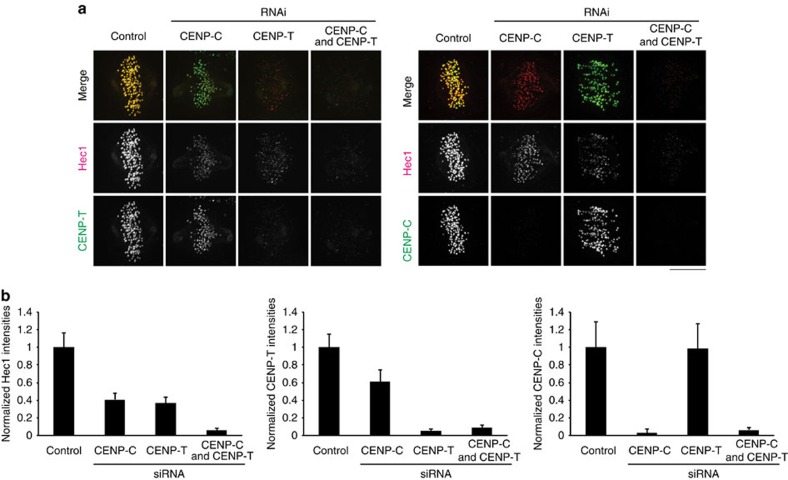
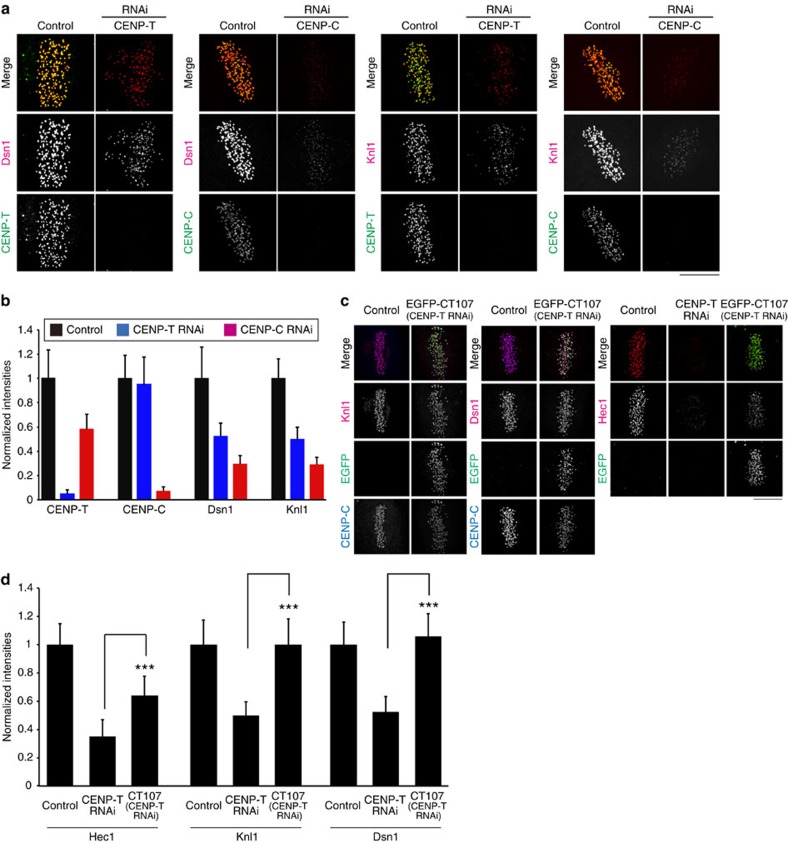
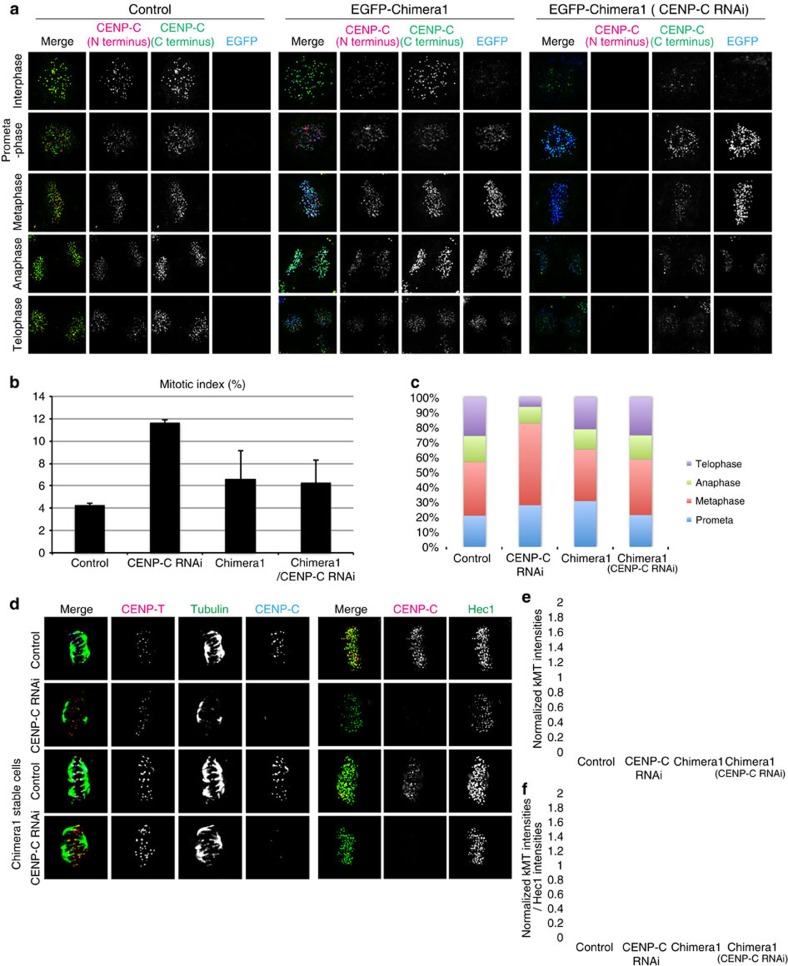
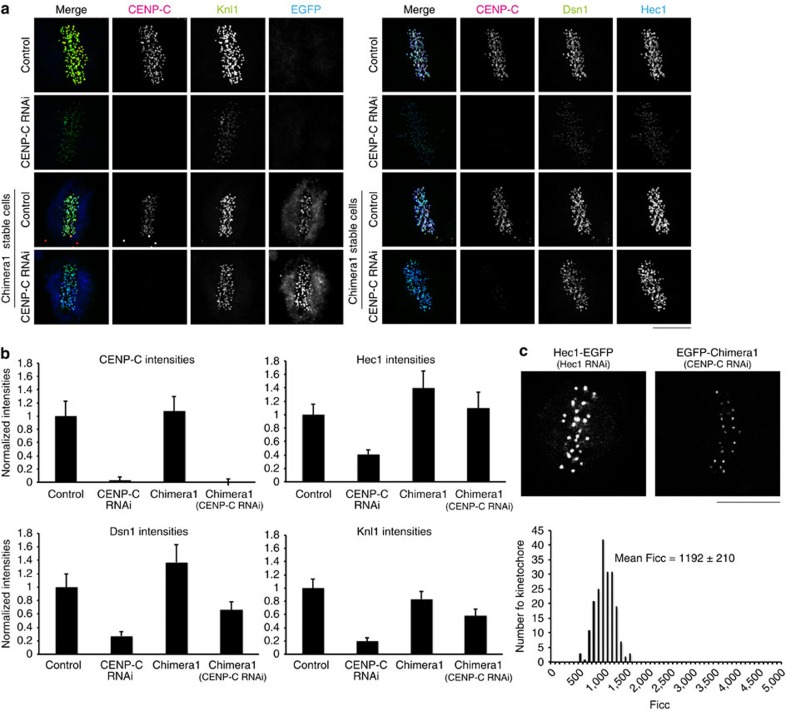
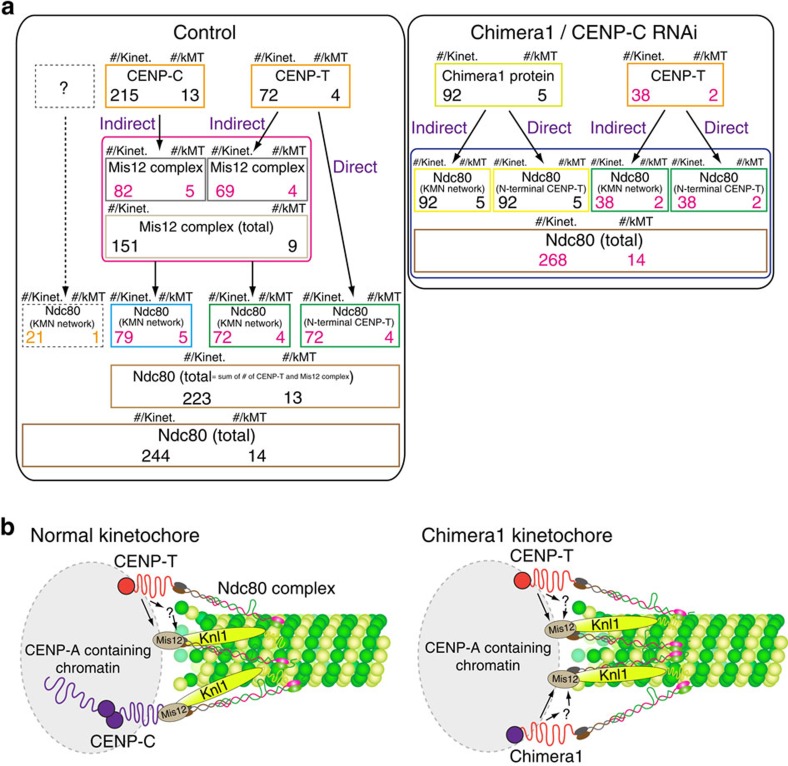
The Ndc80 complex, which mediates end-on attachment of spindle microtubules, is linked to centromeric chromatin in human cells by two inner kinetochore proteins, CENP-T and CENP-C. Here to quantify their relative contributions to Ndc80 recruitment, we combine measurements of kinetochore protein copy number with selective protein depletion assays. This approach reveals about 244 Ndc80 complexes per human kinetochore (∼14 per kinetochore microtubule), 215 CENP-C, 72 CENP-T and only 151 Ndc80s as part of the KMN protein network (1:1:1 Knl1, Mis12 and Ndc80 complexes). Each CENP-T molecule recruits ∼2 Ndc80 complexes; one as part of a KMN network. In contrast, ∼40% of CENP-C recruits only a KMN network. Replacing the CENP-C domain that binds KMN with the CENP-T domain that recruits both an Ndc80 complex and KMN network yielded functional kinetochores. These results provide a quantitative picture of the linkages between centromeric chromatin and the microtubule-binding Ndc80 complex at the human kinetochore.


Figures

Figure 1
Figure 1. CENP-C and CENP-T are inner kinetochore proteins proposed to be primarily responsible for recruiting Ndc80c to kinetochores.
(a) Schematic depiction of the domain organization of human CENP-C, CENP-T, CT107 (CENP-T 107–561 aa) and chimera1, which is a hybrid protein with CENP-T (1–455 aa) and CENP-C (690–943 aa). (b) Current thinking about CENP-C- and CENP-T-dependent linkages to Ndc80c as described in the text. (c) In our studies, the expression levels of EGFP fusion proteins in stably expressed cells are nearly identical to their endogenous proteins. Western blots for comparing the level of EGFP fusion protein in HeLa cell lines compared with wild-type (control) levels (top), Coomassie brilliant blue (CBB) staining of a loading control protein (bottom) and anti-GFP staining to confirm EGFP band (middle). Hec1–EGFP stable cells are (right), EGFP–CENP-T stable cells are (middle) and EGFP–CENP-C stable cells are (left). Endogenous proteins were depleted by RNAi in cells expressing an EGFP fusion protein.
Figure 2
Figure 2. Summary of mean values of measured protein copy numbers per kinetochore at metaphase in control cells.
(a) Mean values for Ficc (integrated kinetochore fluorescence minus background and corrected for kinetochore depth beneath coverslip and photobleaching) for EGFP at metaphase kinetochores in each cell line stably expressing an EGFP fusion protein (Summary of protein copy number values in Table 2). (b) Example of two-colour immunofluorescence (left) and EGFP kinetochore fluorescence measurements (right, n>150 kinetochores/>4 cells, See Methods) for EGFP–CENP-T and EGFP–CENP-C in stably expressing cells. All experiments including live cell imaging and immunofluorescence using cells expressing an EGFP fusion protein were depleted of endogenous protein by RNAi. Kinetochore intensities were normalized relative to EGFP–CENP-T intensities (b). Error bars are s.d. from the means. Scale bar, 5 μm.
Figure 3
Figure 3. Stoichiometry of Ndc80/Hec1 recruitment to kinetochores by CENP-T and CENP-C in metaphase cells.
(a) Typical images of two-colour immunofluorescence of anti-Hec1 and anti-CENP-T (left), anti-Hec1 and anti-CENP-C (right) in control and CENP-T RNAi-, CENP-C RNAi- and CENP-T/-C RNAi-treated cells. (b) Mean kinetochore intensities of Hec1, CENP-T and CENP-C normalized by corresponding control values in each condition of (a). n>200 kinetochores/>5 cells, See Methods. Error bars are s.d. from the mean. Scale bar, 5 μm.
Figure 4
Figure 4. Stoichiometry of Mis12 complex and Knl1 recruitment to kinetochores by CENP-T and CENP-C in metaphase cells.
(a) Typical two-colour immunofluorescence images of kinetochores labelled with anti-Dsn1 or anti-Knl1 and anti-CENP-T or anti-CENP-C in control, and CENP-T RNAi- and CENP-C RNAi-treated cells. (b) Mean values of kinetochore intensities normalized by control values for CENP-T, CENP-C, Dsn1 and Knl1. n>200 kinetochores/>5 cells (see the Methods section). (c,d) Examples of three-colour immunofluorescence of kinetochore Hec1, Dsn1 and Knl1 intensities in control cells, cells treated with CENP-T RNAi, or EGFP–CT107, stably expressed cells after CENP-T RNAi (c). Plots of mean kinetochore intensity of Hec1 (n>330 kinetochores/>9 cells, (see the Methods section), Knl1 (n>400 kinetochores/>11 cells) and Dsn1 (n>340 kinetochores/>9 cells) normalized by control values for the cells (d). Error bars are s.d. from the means. Scale bar, 5 μm. ***P<0.01 (t-test).
Figure 5
Figure 5. Mitotic kinetochores with only CENP-T linkage are sufficient for chromosome segregation.
(a) Representative immunofluorescence images of kinetochores stained with anti-CENP-C (N terminus or C terminus, which only recognized endogenous CENP-C) and anti-GFP during cell cycle in control, EGFP–chimera1 and EGFP–chimera1 cells with treated with CENP-C RNAi. (b) Mitotic index for each condition in a and CENP-C RNAi cells. (c) The ratio of prometaphase, metaphase, anaphase and telophase within mitosis for each condition in b showing that the hybrid EGFP–chimera1 protein rescued CENP-C-depletion phenotype. (d) Representative immunofluorescence images of kinetochores in cells with cold-stable kMTs at metaphase stained with antibodies to CENP-T, tubulin and CENP-C (left) and antibodies to CENP-C and Hec1 (right) for each condition in b. (e) Mean cold-stable kMT intensities (n>60 kMTs) in each condition of b normalized by control value. (f) Values for cold-stable kMT intensities in e normalized by Hec1 intensities in each condition. Error bars are s.d. from the means. Scale bar, 5 μm.
Figure 6
Figure 6. CENP-T(1–455) recruits a KMN network independent of CENP-C.
(a) Representative immunofluorescence images of antibodies to CENP-C, GFP, Knl1, Dsn1 and Hec1 in control, CENP-C RNAi-treated cells, EGFP–chimera1 or EGFP–chimera1 cells treated with CENP-C RNAi. (b) Mean values for immunofluorescence intensities at kinetochores for CENP-C (n>120 kinetochores/>3 cells; see the Methods section), Hec1 (n>200 kinetochores/>5 cells), Dsn1 (n>150 kinetochores/>4 cells) and Knl1 (n>150 kinetochores/>4 cells) normalized by control values for each condition in a. (c) Example live-cell images of Hec1–EGFP cells or EGFP–chimera1 cells (top). The histogram of Ficc measured for EGFP–chimera1 after CENP-C depletion (bottom). Scale bar, 5 μm. Note, a chicken GFP antibody was needed to label EGFP–chimera1 in a. The non-specific cytosol staining was not exhibited by the rabbit GFP antibody used in other assays (for example, Supplementary Fig. 7c).
Figure 7
Figure 7. A quantitative summary of how CENP-T and CENP-C (controls cells) or CENP-T and chimera1 recruit Ndc80/Hec1 to kinetochores.
(a) Summaries of the mean protein copy numbers per kinetochore or per kMT and the mean numbers of Ndc80/Hec1 recruited directly or indirectly as part of the KMN. (b) Updated diagram from Table 2 based on summary data in a for CENP-C- and CENP-T-dependent linkages to Ndc80c and the KMN network at kMT plus ends for normal kinetochores and for chimera1 kinetochores in cells depleted of CENP-C. At kinetochores in control cells, 1 CENP-T recruits ∼2 Ndc80c; one is independent of the KMN network and another is part of the KMN network. Only ∼38% of CENP-C recruits an Ndc80c and it is part of a KMN network. For kinetochores in the chimera1 cells, both CENP-T and the chimera1 protein each recruit two Ndc80c; one directly and the other indirectly by recruitment of a KMN network. In a, the protein copy numbers for CENP-C, CENP-T, Mis12 complex and Ndc80/Hec1 in control cells and in chimera1 cells depleted of CENP-C are derived from Table 2, and Supplementary Notes 1 and 3. The black copy numbers were measured from EGFP fluorescence, the red numbers from quantitative immunofluorescence and the orange numbers from the Ndc80/Hec1 contributed by the sum of CENP-T and Mis12 measured numbers. In the chimera1 cells depleted of CENP-C, we had to assume the same value for CENP-T as we measured for control cells after CENP-C depletion (Table 3). We used a mean value of 17.1 kMTs per kinetochore for control, and a mean value of 18.8 kMTs per kinetochore for chimera1 cells depleted of CENP-C, because kMT intensities under cold treatment in chimera1 cells depleted of CENP-C were 10% higher than control (Fig. 5e).

References

    1. Funabiki H. & Wynne D. J. Making an effective switch at the kinetochore by phosphorylation and dephosphorylation. Chromosoma 122, 135–158 (2013). - PMC - PubMed
    1. Musacchio A. & Salmon E. D. The spindle-assembly checkpoint in space and time. Nat. Rev. Mol. Cell. Biol. 8, 379–393 (2007). - PubMed
    1. Rago F. & Cheeseman I. M. Review series: The functions and consequences of force at kinetochores. J. Cell Biol. 200, 557–565 (2013). - PMC - PubMed
    1. Varma D. & Salmon E. D. The KMN protein network—chief conductors of the kinetochore orchestra. J. Cell Sci. 125, 5927–5936 (2012). - PMC - PubMed
    1. Kato H. et al.. A conserved mechanism for centromeric nucleosome recognition by centromere protein CENP-C. Science 340, 1110–1113 (2013). - PMC - PubMed

Publication types

LinkOut - more resources