. 2015 Sep 8:5:13890.
doi: 10.1038/srep13890.

High content analysis at single cell level identifies different cellular responses dependent on nanomaterial concentrations

Affiliations

High content analysis at single cell level identifies different cellular responses dependent on nanomaterial concentrations

Bella B Manshian et al. Sci Rep. .

Abstract

A mechanistic understanding of nanomaterial (NM) interaction with biological environments is pivotal for the safe transition from basic science to applied nanomedicine. NM exposure results in varying levels of internalized NM in different neighboring cells, due to variances in cell size, cell cycle phase and NM agglomeration. Using high-content analysis, we investigated the cytotoxic effects of fluorescent quantum dots on cultured cells, where all effects were correlated with the concentration of NMs at the single cell level. Upon binning the single cell data into different categories related to NM concentration, this study demonstrates, for the first time, that quantum dots activate both cytoprotective and cytotoxic mechanisms, resulting in a zero net result on the overall cell population, yet with significant effects in cells with higher cellular NM levels. Our results suggest that future NM cytotoxicity studies should correlate NM toxicity with cellular NM numbers on the single cell level, as conflicting mechanisms in particular cell subpopulations are commonly overlooked using classical toxicological methods.


Figures

Figure 1
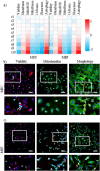
Figure 1. Effects of exposure to varying concentrations of QDots in MSCs and MEFs.
(a) representative confocal micrographs of MSC (left) and MEF (right) cells that were transduced with CellLight Lysosomes-GFP (green) and subsequently exposed to 10 nM QDots (red) for 24 h. yellow/orange dots represent colocalized QDots and lyosomes. Scale bars = 25 μm. The area in the white rectangle is shown as a magnified view below the image. (b) Heat maps of high-content imaging-based data for MSCs and MEFs exposed to varying concentrations of QDots and analyzed for; cell viability, cell membrane damage, mitochondrial ROS, size of the mitochondrial network, area of the cell, skewness of the cell, and level of autophagy. Data are shown as relative values after z-normalization compared to untreated control cells (=1) where the fold-change is indicated by the respective color-code. Data have been acquired for minimum 5000 cells/condition which were gathered from three independent experiments. (c,d) Representative InCell high-content images of control MSCs or MSCs exposed to the QDots at 10 or 20 nM for 24 h, after which the cells were stained for (c) β-actin (green) or (d) mitochondrial ROS (green). Cells were counterstained with Hoechst nuclear stain (blue). Scale bars = 100 μm, the area in the white rectangle is depicted in a magnified view below the original image.
Figure 2
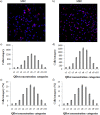
Figure 2. Cellular distribution of cell-associated fluorescent quantum dots.
(a,b) Representative images of (a) MSCs exposed to 10 nM QDots for 24 h or (b) MEFs exposed to 12.5 nMQDots for 24 h. (c,d) Histograms presenting the number of (c) MSC or (d) MEF cells per category when the population is divided into 10 categories spanning the entire range of cellular QDot levels. (e,f) Histograms presenting the percentage of (e) MSC or (f) MEF cells per category for the total population analyzed.
Figure 3
Figure 3. Overview of cellular effects in view of cellular QDot concentration at “non-toxic” conditions.
(a) Heat maps of high-content imaging-based data for MSCs and MEFs exposed to QDots at 10 and 12.5 nM concentrations, respectively, at which slight but non-significant effects had been observed for nearly all the tested parameters based on the total cell population. Cells were analyzed for; cell viability, cell membrane damage, mitochondrial ROS, size of the mitochondrial network, area of the cell, skewness of the cell, and level of autophagy. For every cell, the relative level of QDots was also calculated based on the cellular QDot intensity and area, after which cells were divided into 10 categories based on their cellular QDot levels, ranging from c1 (lowest) to c10 (highest). Observed cellular effects were grouped based on the different categories of intracellular QDot concentrations. The data are shown as relative values after z-normalization compared to untreated control cells (=1) where the fold-change is indicated by the respective color-code. Data were acquired for minimum 5000 cells/condition and were gathered from three independent experiments. (b,c) Representative InCell high-content images of (b) MSCs and (c) MEFs exposed to the QDots at 10 and 12.5 nM, respectively. Red: QDots, Blue: Hoechst nuclear stain, Green: dead cells (left), mitochondrial ROS (middle), β-actin (right). Scale bars = 100 μm, the area in the white rectangle is depicted in a magnified view below the original image.
Figure 4
Figure 4. Overview of conflicting mechanisms involved in general cellular response.
(a) Heat maps of high-content imaging-based data for MSCs, MSCs treated with 3-MA or Z-VAD-fmk or MEFs, MEF Atg5 KO or MEF Bax/Bak DKO exposed to QDots at 10 nM (MSC cells) and 12.5 nM (MEF cells), respectively. Cells were analyzed for; cell viability, autophagy and apoptosis. For every cell, the relative level of QDots was also calculated based on the cellular QDot intensity and area, after which cells were divided into 10 categories based on their cellular QDot levels, ranging from c1(lowest) to c10 (highest). After analysis, the cellular effects were grouped based on the different categories for cellular QDot concentrations. The data are shown as relative values after z-normalization compared to untreated control cells (=1) where the fold-change is indicated by the respective color-code. Data were acquired for minimum 5000 cells/condition and were gathered from three independent experiments. (bd) Representative InCell high-content images of MSCs, MSCs treated with 3-MA or MSC Z-VAD-fmk exposed to QDots (10 nM) for 24 h, after which the cells were stained for (b) cell death, (c) autophagy (LC3) and (d) apoptosis (active caspase-3). Red: QDots, Blue: Hoechst nuclear stain, Green: (b) dead cells, (c) LC3 (d) active caspase-3. Scale bars = 100 μm, the area in the white rectangle is depicted in a magnified view below the original image.

References

    1. Hansen S. F., Maynard A., Baun A. & Tickner J. A. Late lessons from early warnings for nanotechnology. Nature Nanotech. 3, 444–447 (2008). - PubMed
    1. Cho E. C., Zhang Q. & Xia Y. N. The effect of sedimentation and diffusion on cellular uptake of gold nanoparticles. Nature Nanotech. 6, 385–391 (2011). - PMC - PubMed
    1. Kim J. A., Aberg C., Salvati A. & Dawson K. A. Role of cell cycle on the cellular uptake and dilution of nanoparticles in a cell population. Nature Nanotech. 7, 62–68 (2012). - PubMed
    1. Alkilany A. M. & Murphy C. J. Toxicity and cellular uptake of gold nanoparticles: what we have learned so far? J Nanopart. Res. 12, 2313–2333 (2010). - PMC - PubMed
    1. Medina C., Santos-Martinez M. J., Radomski A., Corrigan O. I. & Radomski M. W. Nanoparticles: pharmacological and toxicological significance. Brit. J. Pharmacol. 150, 552–558 (2007). - PMC - PubMed

Publication types

LinkOut - more resources