

Lean body mass index prognostic value for cardiovascular events in patients with coronary artery disease
- PMID: 26345318
- PMCID: PMC4559317
- DOI: 10.1136/heartasia-2015-010644
Lean body mass index prognostic value for cardiovascular events in patients with coronary artery disease
Abstract
Objective: Little is known about the relationship between body composition indicators, including body mass index (BMI), fat mass index (FMI) and lean BMI (LBMI), and adverse outcomes after percutaneous coronary intervention (PCI) in Asian populations. The aim of this study was to clarify this relationship.
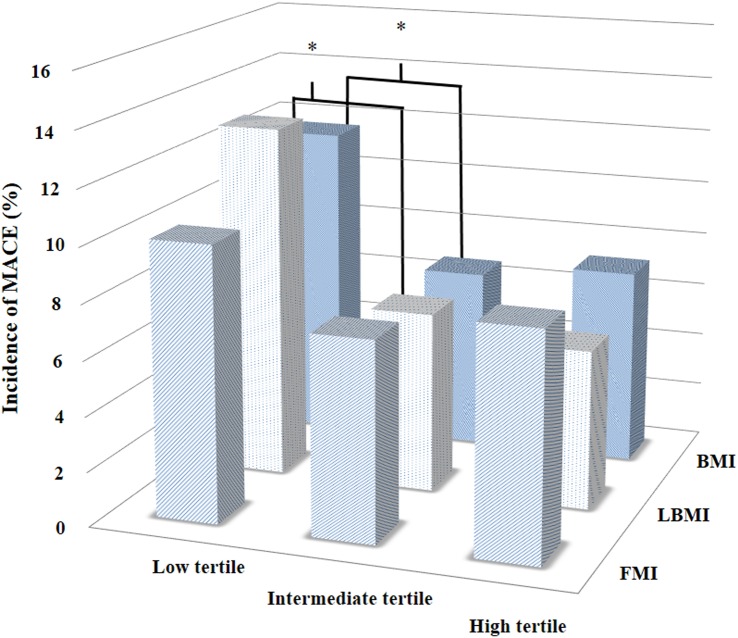
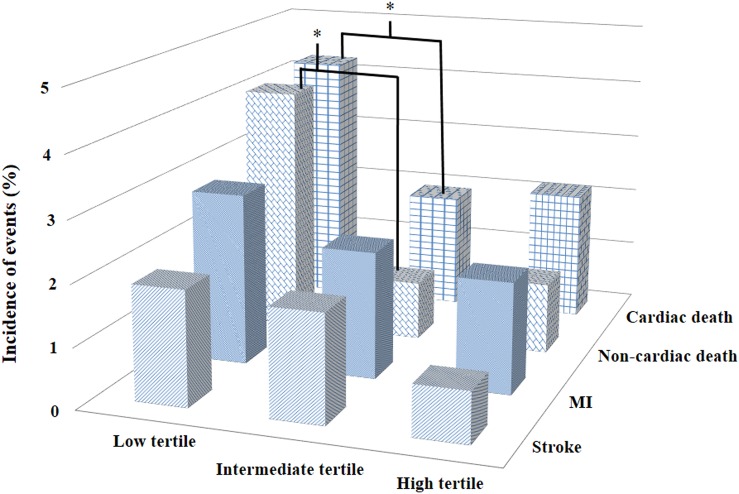
Methods: The SHINANO registry is a prospective, observational, multicenter cohort registry that enrolled 1923 consecutive patients with coronary heart disease (CHD) from August 2012 to July 2013; 66 patients were excluded because of missing data. We evaluated 1857 patients with CHD who underwent PCI (aged 70±11 years; 23% women; BMI 23.8±3.5 kg/m2; LBMI 18.3±1.8 kg/m2; FMI 5.4±2.2 kg/m2). Patients were divided into three groups, based on BMI, LBMI and FMI tertiles, to assess the prognostic value of the three indicators. The primary endpoint was major adverse cardiac events (MACE), including all cause death, non-fatal myocardial infarction and ischaemic stroke at 1 year.
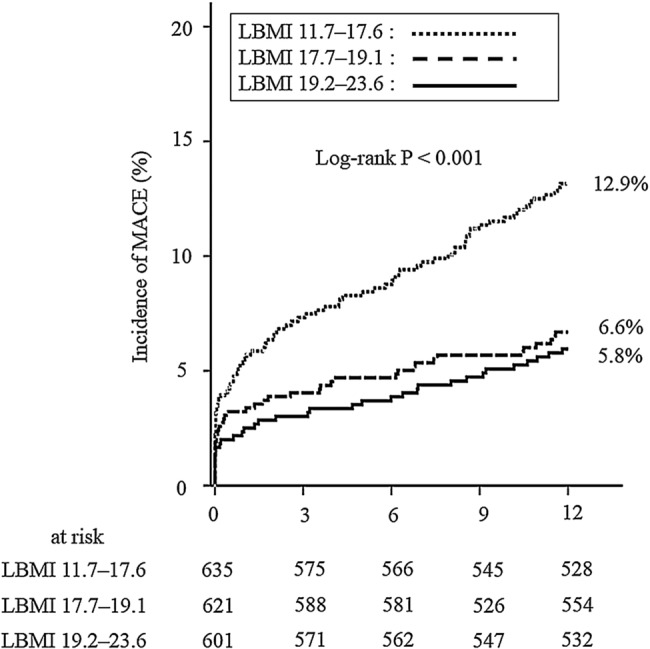
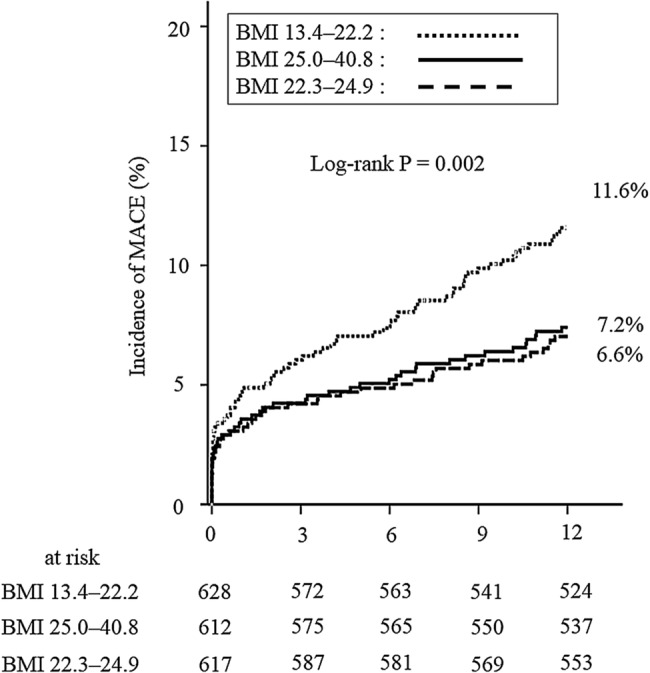
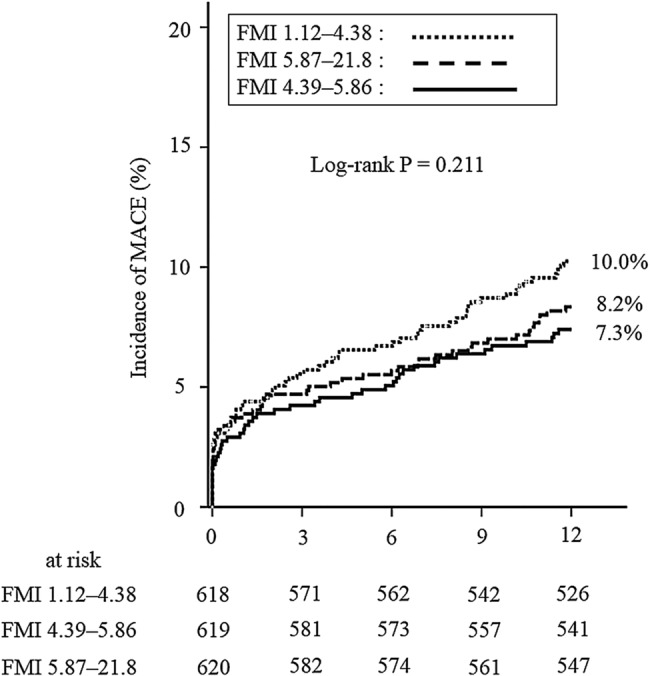
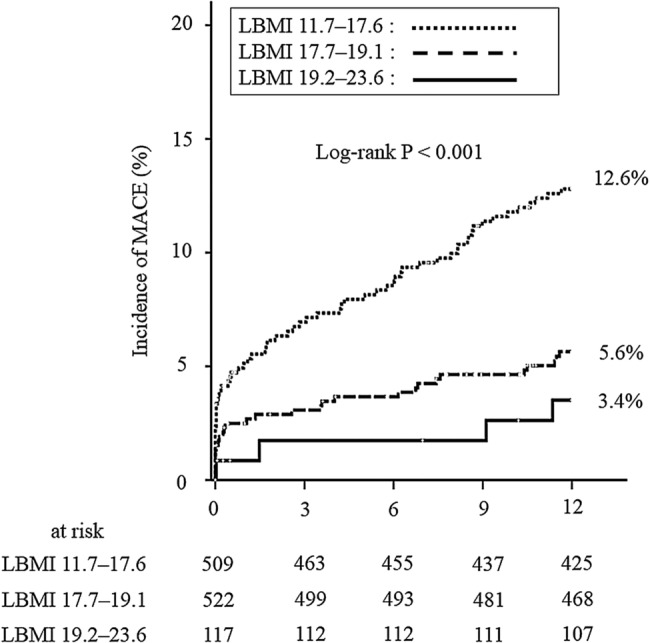
Results: Over a 1 year follow-up period (1776 patients, 95.6%), the cumulative MACE incidence was 8.7% (161 cases). Using Kaplan-Meier analysis, the MACE incidence was significantly higher in patients with lower BMI values (13.4-22.2 kg/m2) (p=0.002) and lower LBMI values (11.6-17.6 kg/m2) (p<0.001); this trend was not observed for FMI. Multivariate Cox regression analysis showed that lower LBMI but not lower BMI values were predictive of a higher MACE incidence (HR 1.55; 95% CI 1.05 to 2.30).
Conclusions: Lower LBMI values are associated with adverse outcomes in an Asian population with CHD undergoing PCI. LBMI is a better predictor of MACE than BMI or FMI.
Clinical trial registration: UMIN-ID; 000010070.
Keywords: CORONARY ARTERY DISEASE.
Figures
References
-
- Adams KF, Schatzkin A, Harris TB et al. . Overweight, obesity, mortality in a large prospective cohort of persons 50 to 71 years old. N Engl J Med 2006;355:763–78. doi:10.1056/NEJMoa055643 - DOI - PubMed
-
- Anonymous. Obesity: preventing and managing the global epidemic. Report of a WHO consultation. World Health Organ Tech Rep Ser 2000;894:i–xii. - PubMed
-
- Flegal KM, Graubard BI, Williamson DF et al. . Excess deaths associated with underweight, overweight, and obesity. JAMA 2004;293:1861–7. doi:10.1001/jama.293.15.1861 - DOI - PubMed
-
- Flegal KM, Kit BK, Orpana H et al. . Association of all-cause mortality with overweight and obesity using standard body mass index categories: a systematic review and meta-analysis. JAMA 2013;309:71–82. doi:10.1001/jama.2012.113905 - DOI - PMC - PubMed
-
- Wildman RP, Muntner P, Reynolds K et al. . The obese without cardiometabolic risk factor clustering and the normal weight with cardiometabolic clustering: prevalence and correlates of 2 phenotypes among the US population (NHANES 1999–2004). Arch Intern Med 2008;168:1617–24. doi:10.1001/archinte.168.15.1617 - DOI - PubMed
LinkOut - more resources
Full Text Sources
Other Literature Sources
Miscellaneous