. 2015 Sep 8:5:13793.
doi: 10.1038/srep13793.

Probing cytochrome c in living mitochondria with surface-enhanced Raman spectroscopy

Affiliations

Probing cytochrome c in living mitochondria with surface-enhanced Raman spectroscopy

Nadezda A Brazhe et al. Sci Rep. .

Abstract

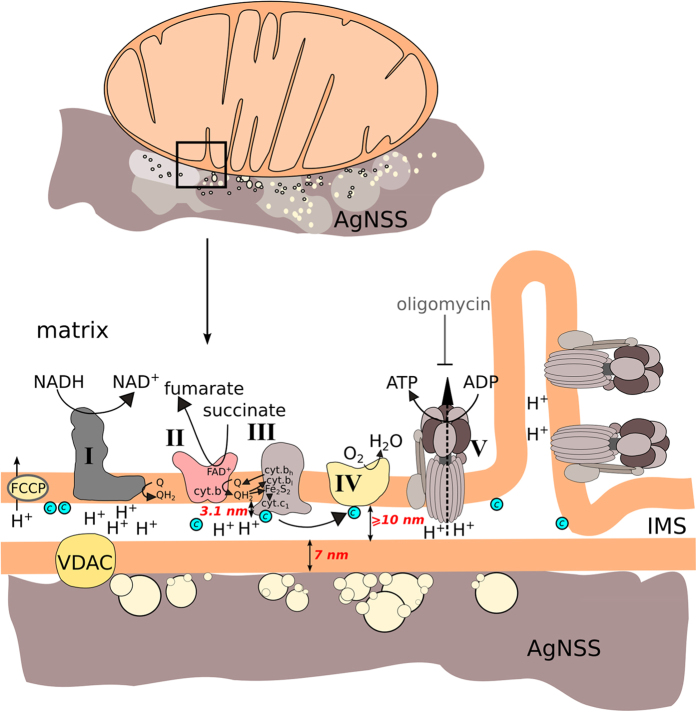
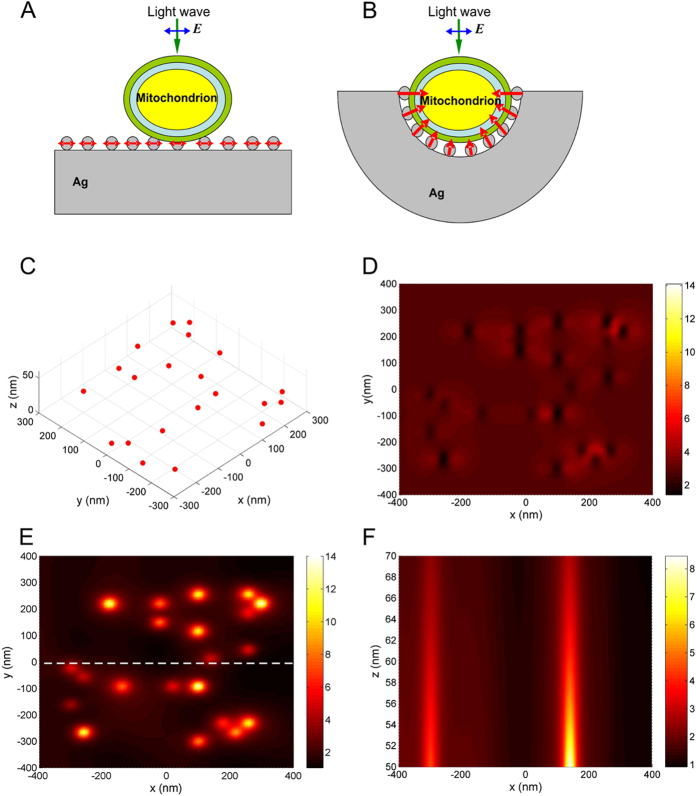
Selective study of the electron transport chain components in living mitochondria is essential for fundamental biophysical research and for the development of new medical diagnostic methods. However, many important details of inter- and intramembrane mitochondrial processes have remained in shadow due to the lack of non-invasive techniques. Here we suggest a novel label-free approach based on the surface-enhanced Raman spectroscopy (SERS) to monitor the redox state and conformation of cytochrome c in the electron transport chain in living mitochondria. We demonstrate that SERS spectra of living mitochondria placed on hierarchically structured silver-ring substrates provide exclusive information about cytochrome c behavior under modulation of inner mitochondrial membrane potential, proton gradient and the activity of ATP-synthetase. Mathematical simulation explains the observed enhancement of Raman scattering due to high concentration of electric near-field and large contact area between mitochondria and nanostructured surfaces.


Figures

Figure 1
Figure 1. Scheme of mitochondria placed on silver nanostructured surface (AgNSS).
Schematic presentation of the magnified view of the outer mitochondrial membrane in a contact with AgNSS, intermembrane space (IMS) and internal mitochondrial membrane with complexes of the electron transport chain. Cytochromes of b and c-type are shown in corresponding complexes. Cytochrome c is shown as cyan ball. Red numbers indicate the approximate height of the outer mitochondrial membrane, size of IMS and IMS domain of complex III (data on distances and sizes of mitochondrial elements are taken from1129). VDAC–voltage-dependent anion channel; FCCP—protonophore (Carbonyl cyanide-p-trifluoromethoxyphenylhydrazone) used in the study.
Figure 2
Figure 2. SERS spectra of mitochondria.
(A) (1) Spectrum of mitochondrial buffer on AgNSS; (2) spectrum of mitochondria suspension used in SERS experiments placed into the Petri dish with smooth silver plate without nanostructures; (3) Raman spectrum of concentrated mitochondrial aggregate placed into ordinary Petri dish; excitation power 1.5 mW, objective x63, NA 0.9, registration time 20 s; (4) SERS spectrum of mitochondria suspension placed on AgNSS after pyruvate, succinate, ADP and MgCl2 application; (5) SERS spectrum of mitochondria suspension placed on AgNSS after application of sodium dithionite. SERS spectra were recorded from the diluted mitochondria sample with excitation power 1.5 mW; objective x5, NA 0.15, registration time 20 s. (B) SERS spectra of mitochondria recorded from different places of AgNSS shown schematically by colored spots in Fig. D. (C) SERS spectra of mitochondria recorded from the same place on AgNSS with time lapse between spectra acquisition of 30 s. Accumulation time for each spectrum is 20 s. Dotted vertical lines indicate positions of maxima of the most intensive peaks. Vertical scale bars are equal to 200 a.u in all figures. (D) Optical microphotograph of Ag nanostructured surface in the transmitted light. Horizontal length of the microphotograph is 100 μm. Detailed morphology of AgNSSs is shown in Fig. 4.
Figure 3
Figure 3. Dependence of SERS spectra of mitochondria on proton-motive force and activity of ATP synthesis.
(A) SERS spectra of mitochondria before and after application of FCCP (0,5 μM) (lower and upper spectra, respectively). (B) SERS spectra of mitochondria before and after application of oligomycin (10 μM) (lower and upper spectra, respectively). (C) Ratios of peak intensities calculated for SERS spectra of mitochondria in control (after application of pyruvate, succinate, ADP and MgCl2, black bars) and in 2 min after application of protonofor FCCP (0,5 μM) (red bars, number of experiments n = 3) or oligomycin (10 μM) (blue bars, number of experiments n = 3). Ratios were calculated by dividing intensities of peak maxima at 750 by 1638 cm−1 (I750/I1638), 1170 by 1638 cm−1 (I1170/I1638) and 1371 by 1638 cm−1 (I1371/I1638). Ratios in control measurements were taken as 100%. Vertical bars show SE value, %. SE value of control ratios were calculated from 10 independent measurements of control SERS spectra from the same spot.
Figure 4
Figure 4. Characterization of Ag nanostructured surfaces.
(A) Optical microphotograph of Ag nanostructured surface in the transmitted light. The inset figure shows AgNSS in reflected light and the reflectivity spectrum of AgNSS obtained with x50 magnification, objective NA 0.75. (BD) Scanning electron microscopy images of Ag nanostructured surface with different magnifications; white horizontal scale bars are equaled to 10, 1 and 0.2 μm, respectively. Figure B shows overlapping of nanostructured silver rings. Figure C demonstrates hierarchically organized clusters (“bricks”) forming concaved walls of nanostructured silver rings. Figure D shows magnified view of porous nanostructured silver “bricks” covered with smaller spherical silver nanoparticles. Figure E demonstrates TEM image of the hierarchically structured silver showing channels in the porous silver bricks. The channels are filled with nanometer—sized embryocrystals of silver formed by fast thermal decomposition of diaminsilver hydroxide solution from initially sprayed aerosol droplets. The embryocrystals are being moved through the channels onto the surface of porous silver bricks due to capillary forces followed by evaporation of water solvent and the crystal overgrowth up to the sizes of “sesame seeds”. White horizontal scale bar is equaled to 5 nm.
Figure 5
Figure 5. Results of mathematical simulation.
Schematic presentation of a mitochondrion located: (A) on a flat Ag nanostructured surface with Ag nanoparticles and (B) in a cavity on Ag nanostructured surface. Mitochondrion is illuminated by linear-polarized light wave. Blue arrows show polarization of the electric field E. Red arrows indicate: (A) induced total dipole moment of Ag nanoparticles, and (B) normal component (with respect to the substrate surface) of the light-induced dipole moment of Ag nanoparticles. (C) Distribution of Ag nanoparticles with diameters of 40–50 nm on Ag surface used in numerical simulations. (D) Electric field intensity calculated in a plane, 60 nm above the Ag surface (XY-plane), when the structure is normally irradiated by linear-polarized plane light wave with the wavelength of 532 nm. (E) Electric field intensity calculated in a plane, 60 nm above the Ag surface, when the structure is irradiated at 65 degrees by TM-polarized plane light wave with the wavelength of 532 nm. (F) Distribution of the electric field intensity (corresponding to the case (E)) in the plane perpendicular to the Ag surface. The plane passes through the dashed line shown in (E).

References

    1. Nicholls D. G. & Ferguson S. J. Bioenergetics. (Ed. Waltham M. A.). (Academic Press Elsevier Science Ltd., 2002).
    1. Mammucari C. & Rizzuto R. Signaling pathways in mitochondrial dysfunction and aging. Mech. Ageing Dev. 131, 536–543 (2003). - PMC - PubMed
    1. Chu C. T. et al. Cardiolipin externalization to the outer mitochondrial membrane acts as an elimination signal for mitophagy in neuronal cells. Nat. Cell Biol. 15, 1197–205 (2013). - PMC - PubMed
    1. Murphy M. P. How mitochondria produce reactive oxygen species. Biochem. J. 417, 1–13 (2009). - PMC - PubMed
    1. Chouchani E. T. et al. Cardioprotection by S-nitrosation of a cysteine switch on mitochondrial complex . Nature Medicine, 19, 753–759 (2013). - PMC - PubMed

Publication types