Clinical Trial
. 2015:2015:518284.
doi: 10.1155/2015/518284. Epub 2015 Aug 4.

Prognosis Relevance of Serum Cytokines in Pancreatic Cancer

Affiliations
Clinical Trial

Prognosis Relevance of Serum Cytokines in Pancreatic Cancer

Carolina Torres et al. Biomed Res Int. 2015.

Abstract

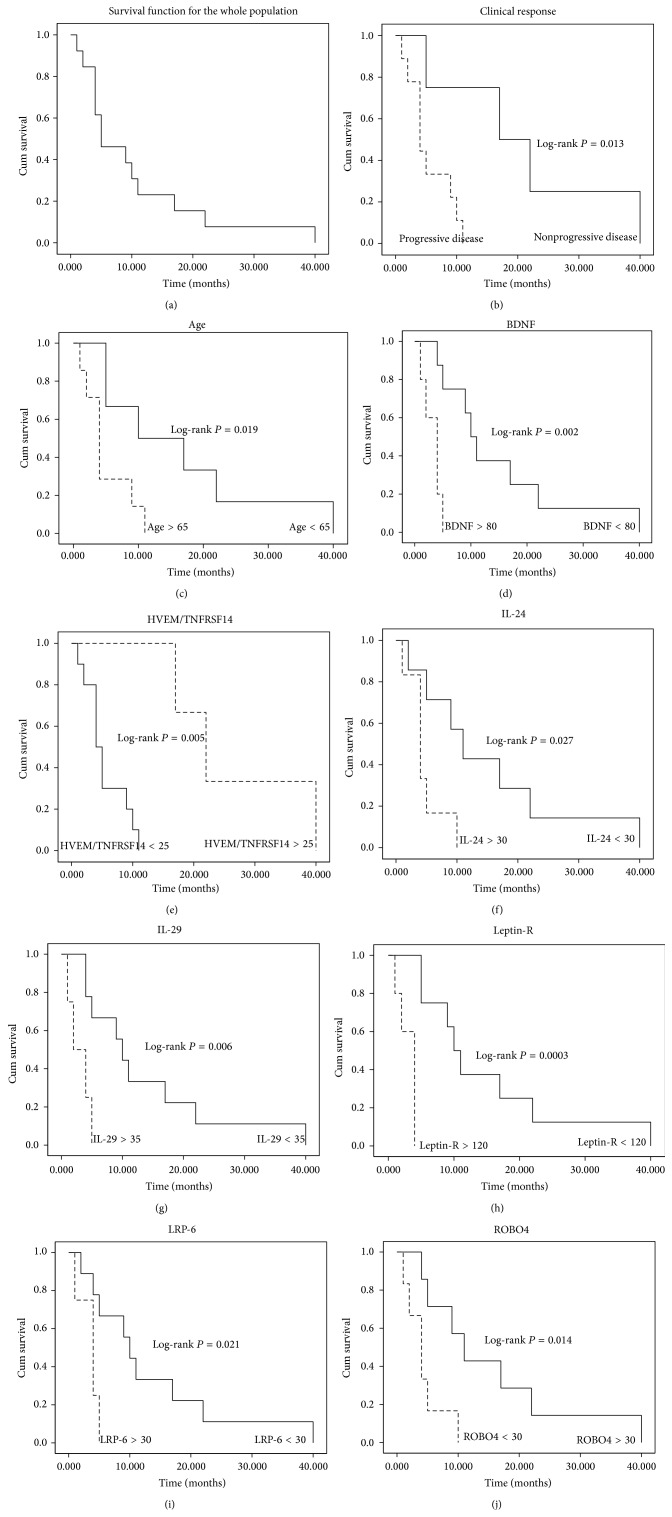
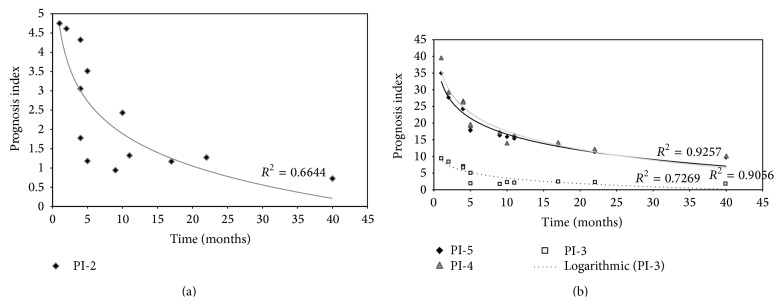
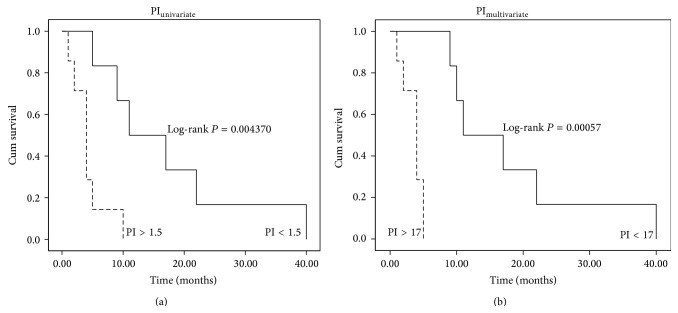
The overall survival of patients with pancreatic ductal adenocarcinoma is extremely low. Although gemcitabine is the standard used chemotherapy for this disease, clinical outcomes do not reflect significant improvements, not even when combined with adjuvant treatments. There is an urgent need for prognosis markers to be found. The aim of this study was to analyze the potential value of serum cytokines to find a profile that can predict the clinical outcome in patients with pancreatic cancer and to establish a practical prognosis index that significantly predicts patients' outcomes. We have conducted an extensive analysis of serum prognosis biomarkers using an antibody array comprising 507 human cytokines. Overall survival was estimated using the Kaplan-Meier method. Univariate and multivariate Cox's proportional hazard models were used to analyze prognosis factors. To determine the extent that survival could be predicted based on this index, we used the leave-one-out cross-validation model. The multivariate model showed a better performance and it could represent a novel panel of serum cytokines that correlates to poor prognosis in pancreatic cancer. B7-1/CD80, EG-VEGF/PK1, IL-29, NRG1-beta1/HRG1-beta1, and PD-ECGF expressions portend a poor prognosis for patients with pancreatic cancer and these cytokines could represent novel therapeutic targets for this disease.


Figures

Figure 1
Figure 1
(a) shows Kaplan-Meier disease-specific survival curve for the whole population in the study. The Kaplan-Meier survival curve is defined as the probability of surviving in a given period of time. Each period of time is the interval between two nonsimultaneous terminal events. There were no survival data censored as no information about the survival time of any individual was lost. (b–h) Plots depict Kaplan-Meier survival curves of individual biomarkers tagged as significant prognosis markers: (b) clinical response; (c) age; (d) BDNF; (e) HVEM/TNFRSF14; (f) IL-24; (g) IL-29; (h) leptin-R; (i) LRP-6; and (j) ROBO4. The cut-off values were determined considering those points which maximized the dichotomization between poor and fair prognosis. The P values for the log-rank tests are shown for every variable.
Figure 2
Figure 2
The Cox's regression model. Observed (denoted by square, diamonds and triangles points) and predicted (denoted by solid line) prognosis curves for the PDAC patients according to (a) univariate o and (b) multivariate Cox's proportional hazard model analysis. As explained in the text, the stepwise procedure based on the likelihood ratio was used to select a model containing a statistically significant subset of prognosis factors. The three predicted prognosis curves in (b) are derived from step 3 (where three cytokines are included), step 4 (four cytokines included), and step 5 (five cytokines included) of this stepwise procedure. The predicted survival curves are adjusted to a logarithmic distribution function, as expected. The coefficient of determination R 2 is illustrative of the model goodness of fit. As coefficient attested, these models would yield useful predictions, being the five cytokines multivariate model the most accurate, reaching a 92.6%. This means that our PI properly models approximately 93% of the survival variation.
Figure 3
Figure 3
Kaplan-Meier PI survival curves. (a) shows survival plot for PI derived from univariate model, embracing 2 cytokines. A cut-off of 1.5 was chosen to divide cohort of patients in short (<6 months) and long (>6 months) survival times. (b) shows survival plot for PI derived from multivariate model, embracing 5 cytokines. A cut-off of 17 was chosen to divide cohort of patients in short (<6 months) and long (>6 months) survival times. Both PI cut-off values were established considering the best discrimination between poor and fair prognosis. The P values for the log-rank tests are shown for both comparisons.

References

    1. Siegel R., Naishadham D., Jemal A. Cancer statistics, 2012. CA: Cancer Journal for Clinicians. 2012;62(1):10–29. doi: 10.3322/caac.20138. - DOI - PubMed
    1. Samuel N., Hudson T. J. The molecular and cellular heterogeneity of pancreatic ductal adenocarcinoma. Nature Reviews Gastroenterology and Hepatology. 2012;9(2):77–87. doi: 10.1038/nrgastro.2011.215. - DOI - PubMed
    1. Zieger K. High throughput molecular diagnostics in bladder cancer—on the brink of clinical utility. Molecular Oncology. 2008;1(4):384–394. doi: 10.1016/j.molonc.2007.11.002. - DOI - PMC - PubMed
    1. Hidalgo M., Von Hoff D. D. Translational therapeutic opportunities in ductal adenocarcinoma of the pancreas. Clinical Cancer Research. 2012;18(16):4249–4256. doi: 10.1158/1078-0432.ccr-12-1327. - DOI - PubMed
    1. Costello E., Greenhalf W., Neoptolemos J. P. New biomarkers and targets in pancreatic cancer and their application to treatment. Nature Reviews Gastroenterology and Hepatology. 2012;9(8):435–444. doi: 10.1038/nrgastro.2012.119. - DOI - PubMed

Publication types