Pathway optimization by re-design of untranslated regions for L-tyrosine production in Escherichia coli
- PMID: 26346938
- PMCID: PMC4561953
- DOI: 10.1038/srep13853
Pathway optimization by re-design of untranslated regions for L-tyrosine production in Escherichia coli
Abstract
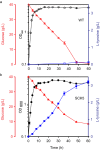
L-tyrosine is a commercially important compound in the food, pharmaceutical, chemical, and cosmetic industries. Although several attempts have been made to improve L-tyrosine production, translation-level expression control and carbon flux rebalancing around phosphoenolpyruvate (PEP) node still remain to be achieved for optimizing the pathway. Here, we demonstrate pathway optimization by altering gene expression levels for L-tyrosine production in Escherichia coli. To optimize the L-tyrosine biosynthetic pathway, a synthetic constitutive promoter and a synthetic 5'-untranslated region (5'-UTR) were introduced for each gene of interest to allow for control at both transcription and translation levels. Carbon flux rebalancing was achieved by controlling the expression level of PEP synthetase using UTR Designer. The L-tyrosine productivity of the engineered E. coli strain was increased through pathway optimization resulting in 3.0 g/L of L-tyrosine titer, 0.0354 g L-tyrosine/h/g DCW of productivity, and 0.102 g L-tyrosine/g glucose yield. Thus, this work demonstrates that pathway optimization by 5'-UTR redesign is an effective strategy for the development of efficient L-tyrosine-producing bacteria.
Conflict of interest statement
The authors declare no competing financial interests.
Figures


Similar articles
-
[Co-expressions of phosphoenolpyruvate synthetase A (ppsA) and transketolase A (tktA) genes of Escherichia coli].Sheng Wu Gong Cheng Xue Bao. 2003 May;19(3):301-6. Sheng Wu Gong Cheng Xue Bao. 2003. PMID: 15969011 Chinese.
-
Rerouting carbon flux for optimized biosynthesis of mesaconate in Escherichia coli.Appl Microbiol Biotechnol. 2018 Sep;102(17):7377-7388. doi: 10.1007/s00253-018-9135-x. Epub 2018 Jun 21. Appl Microbiol Biotechnol. 2018. PMID: 29926142
-
Application of Dynamic Regulation to Increase L-Phenylalanine Production in Escherichia coli.J Microbiol Biotechnol. 2019 Jun 28;29(6):923-932. doi: 10.4014/jmb.1901.01058. J Microbiol Biotechnol. 2019. PMID: 31154747
-
Construction of recombinant Escherichia coli for production of L-phenylalanine-derived compounds.World J Microbiol Biotechnol. 2021 Apr 15;37(5):84. doi: 10.1007/s11274-021-03050-1. World J Microbiol Biotechnol. 2021. PMID: 33855641 Review.
-
Advances and prospects in metabolic engineering of Escherichia coli for L-tryptophan production.World J Microbiol Biotechnol. 2022 Jan 6;38(2):22. doi: 10.1007/s11274-021-03212-1. World J Microbiol Biotechnol. 2022. PMID: 34989926 Review.
Cited by
-
Upcycling chitin-containing waste into organonitrogen chemicals via an integrated process.Proc Natl Acad Sci U S A. 2020 Apr 7;117(14):7719-7728. doi: 10.1073/pnas.1919862117. Epub 2020 Mar 25. Proc Natl Acad Sci U S A. 2020. PMID: 32213582 Free PMC article.
-
Synthetic small regulatory RNAs in microbial metabolic engineering.Appl Microbiol Biotechnol. 2021 Jan;105(1):1-12. doi: 10.1007/s00253-020-10971-8. Epub 2020 Nov 17. Appl Microbiol Biotechnol. 2021. PMID: 33201273 Review.
-
3'-UTR engineering to improve soluble expression and fine-tuning of activity of cascade enzymes in Escherichia coli.Sci Rep. 2016 Jul 11;6:29406. doi: 10.1038/srep29406. Sci Rep. 2016. PMID: 27406241 Free PMC article.
-
Engineered Escherichia coli platforms for tyrosine-derivative production from phenylalanine using phenylalanine hydroxylase and tetrahydrobiopterin-regeneration system.Biotechnol Biofuels Bioprod. 2023 Jul 18;16(1):115. doi: 10.1186/s13068-023-02365-5. Biotechnol Biofuels Bioprod. 2023. PMID: 37464414 Free PMC article.
-
Synthetic redesign of Escherichia coli for cadaverine production from galactose.Biotechnol Biofuels. 2017 Jan 21;10:20. doi: 10.1186/s13068-017-0707-2. eCollection 2017. Biotechnol Biofuels. 2017. PMID: 28127401 Free PMC article.
References
-
- Bongaerts J., Kramer M., Muller U., Raeven L. & Wubbolts M. Metabolic engineering for microbial production of aromatic amino acids and derived compounds. Metab. Eng. 3, 289–300 (2001). - PubMed
-
- Seetharam G. & Saville B. A. L-DOPA production from tyrosinase immobilized on zeolite. Enzyme. Microb.Tech. 31, 747–753 (2002).
-
- Gosset G. Production of aromatic compounds in bacteria. Curr. Opin. Biotechnol. 20, 651–658 (2009). - PubMed
-
- Riley P. A. Melanin. Int. J. Biochem. Cell. Biol. 29, 1235–1239 (1997). - PubMed
-
- Sariaslani F. S. Development of a combined biological and chemical process for production of industrial aromatics from renewable resources. Annu. Rev. Microbiol. 61, 51–69 (2007). - PubMed
Publication types
MeSH terms
Substances
LinkOut - more resources
Full Text Sources
Other Literature Sources
Miscellaneous

