. 2015 Jul 31:9:3989-4104.
doi: 10.2147/DDDT.S85426. eCollection 2015.

A bioinformatic and mechanistic study elicits the antifibrotic effect of ursolic acid through the attenuation of oxidative stress with the involvement of ERK, PI3K/Akt, and p38 MAPK signaling pathways in human hepatic stellate cells and rat liver

Affiliations

A bioinformatic and mechanistic study elicits the antifibrotic effect of ursolic acid through the attenuation of oxidative stress with the involvement of ERK, PI3K/Akt, and p38 MAPK signaling pathways in human hepatic stellate cells and rat liver

Wenhua He et al. Drug Des Devel Ther. .

Abstract

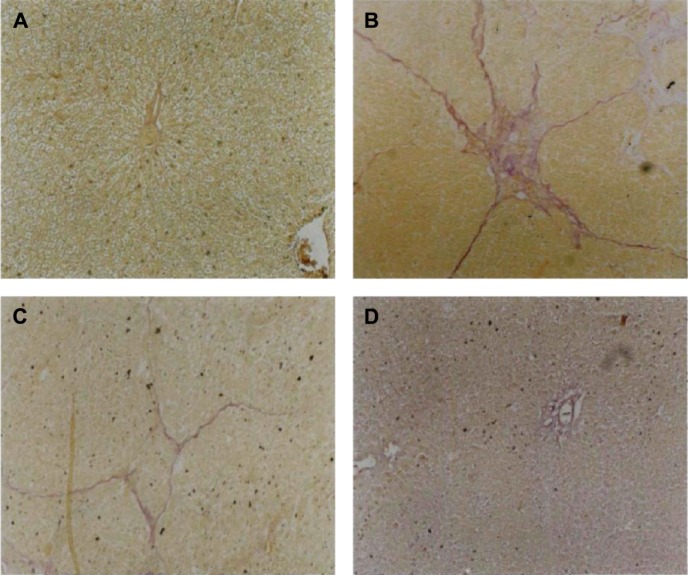
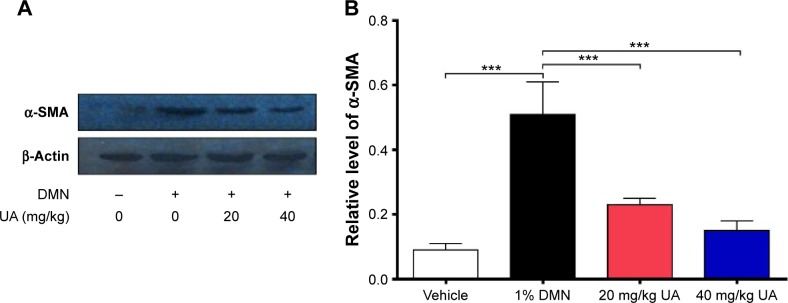
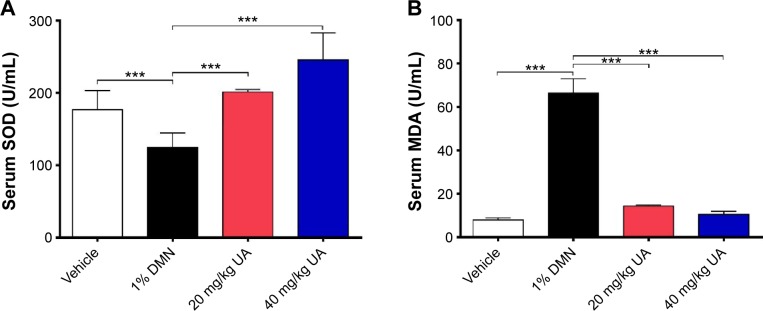
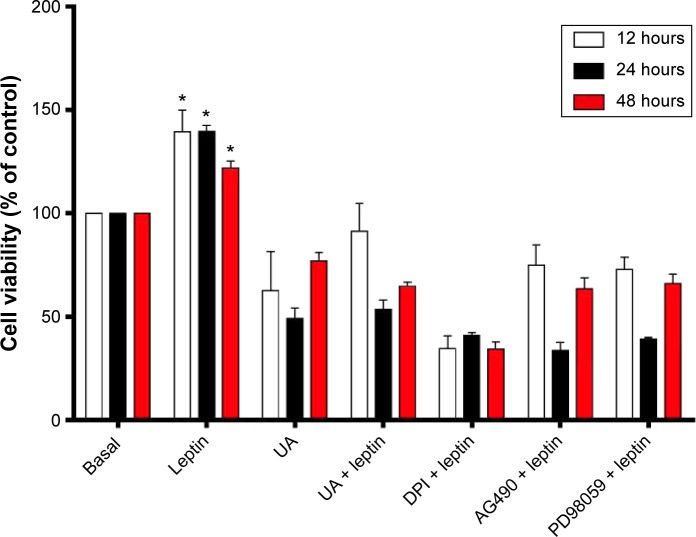
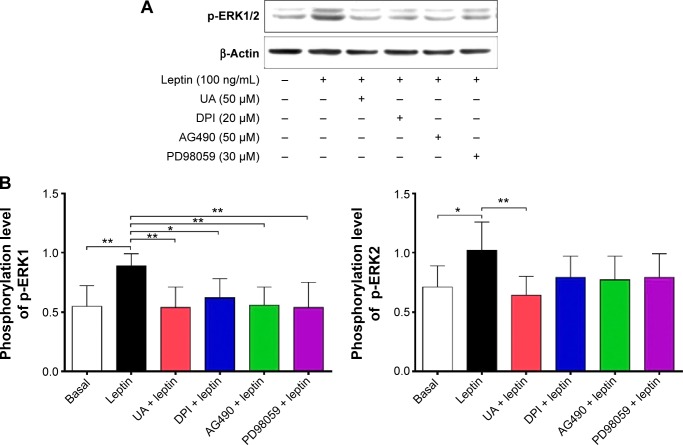
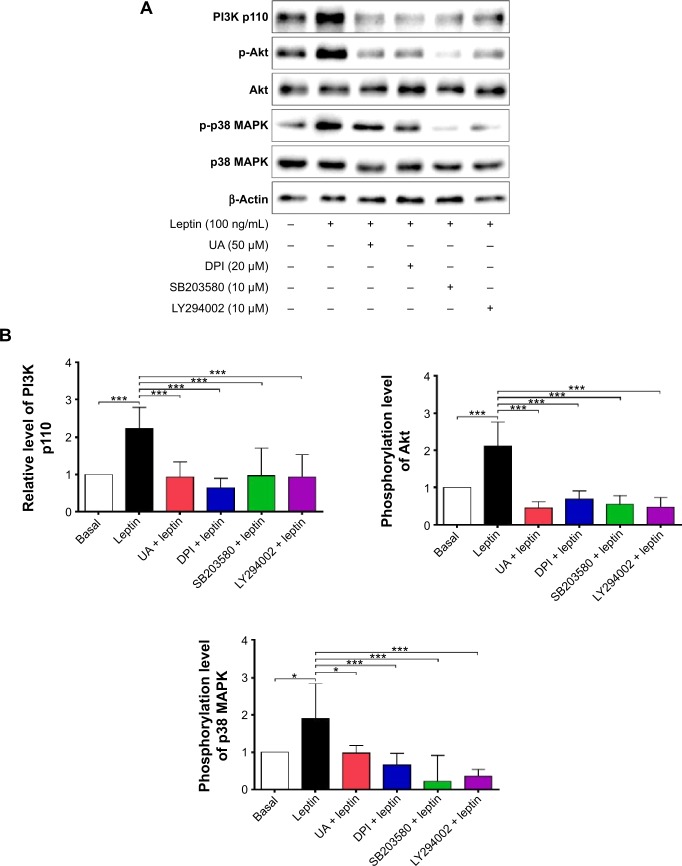
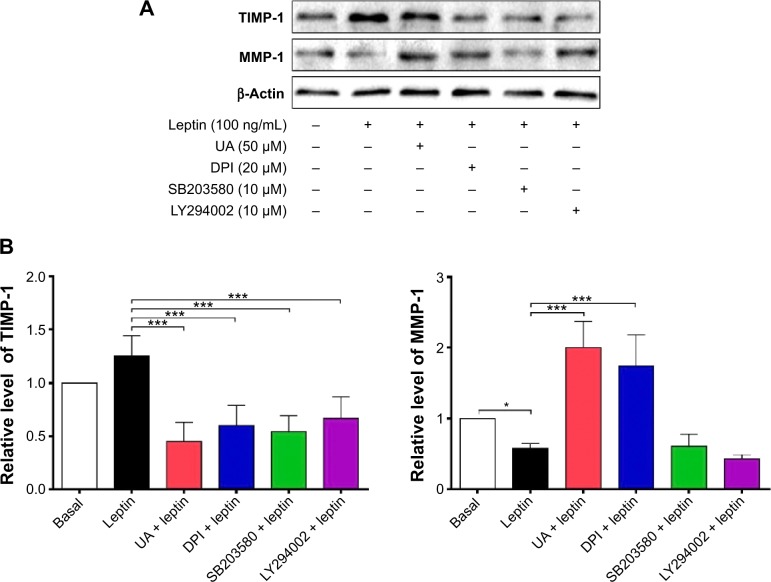
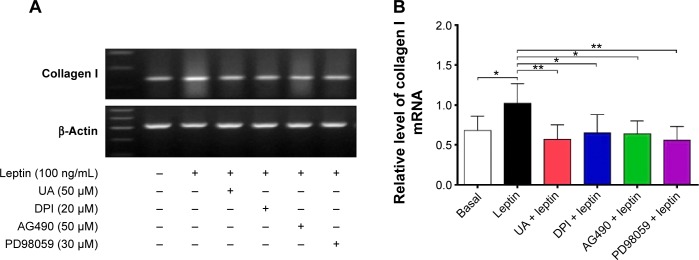
NADPH oxidases (NOXs) are a predominant mediator of redox homeostasis in hepatic stellate cells (HSCs), and oxidative stress plays an important role in the pathogenesis of liver fibrosis. Ursolic acid (UA) is a pentacyclic triterpenoid with various pharmacological activities, but the molecular targets and underlying mechanisms for its antifibrotic effect in the liver remain elusive. This study aimed to computationally predict the molecular interactome and mechanistically investigate the antifibrotic effect of UA on oxidative stress, with a focus on NOX4 activity and cross-linked signaling pathways in human HSCs and rat liver. Drug-drug interaction via chemical-protein interactome tool, a server that can predict drug-drug interaction via chemical-protein interactome, was used to predict the molecular targets of UA, and Database for Annotation, Visualization, and Integrated Discovery was employed to analyze the signaling pathways of the predicted targets of UA. The bioinformatic data showed that there were 611 molecular proteins possibly interacting with UA and that there were over 49 functional clusters responding to UA. The subsequential benchmarking data showed that UA significantly reduced the accumulation of type I collagen in HSCs in rat liver, increased the expression level of MMP-1, but decreased the expression level of TIMP-1 in HSC-T6 cells. UA also remarkably reduced the gene expression level of type I collagen in HSC-T6 cells. Furthermore, UA remarkably attenuated oxidative stress via negative regulation of NOX4 activity and expression in HSC-T6 cells. The employment of specific chemical inhibitors, SB203580, LY294002, PD98059, and AG490, demonstrated the involvement of ERK, PI3K/Akt, and p38 MAPK signaling pathways in the regulatory effect of UA on NOX4 activity and expression. Collectively, the antifibrotic effect of UA is partially due to the oxidative stress attenuating effect through manipulating NOX4 activity and expression. The results suggest that UA may act as a promising antifibrotic agent. More studies are warranted to evaluate the safety and efficacy of UA in the treatment of liver fibrosis.

Keywords: DAVID; DDI-CPI; NADPH oxidase; ROS; liver fibrosis; ursolic acid.


Figures

Figure 1
Figure 1
Effect of UA on DMN-induced hepatic fibrogenesis in rats. Notes: Rats were administered with 1% DMN dissolved in saline (1 mL/kg body weight) via intraperitoneal injection for 3 consecutive days per week for 4 weeks to induce liver fibrosis. Representative photomicrographs of the liver histology from groups (n=5) treated with vehicle control (A), DMN alone (B), DMN +20 mg/kg UA (C), and DMN +40 mg/kg UA (D). Magnification: ×100. Abbreviations: UA, ursolic acid; DMN, dimethylnitrosamine.
Figure 2
Figure 2
Effect of UA on the expression of α-SMA in rat liver. Notes: Rats were administered with 1% DMN dissolved in saline (1 mL/kg body weight) via intraperitoneal injection for 3 consecutive days per week for 4 weeks to induce liver fibrosis. (A) Representative blot of α-SMA from groups treated with vehicle control, DMN alone, DMN +20 mg/kg UA, and DMN +40 mg/kg UA. (B) Bar graph showing the relative expression level of α-SMA in rat liver. β-Actin acts as an internal control. Data are expressed as mean ± SD (n=5). ***P<0.001. + and − represent with or without treatment, respectively. Abbreviations: UA, ursolic acid; α-SMA, α-smooth muscle actin; DMN, dimethylnitrosamine; SD, standard deviation.
Figure 3
Figure 3
UA increased serum SOD level and decreased serum MDA level in liver fibrotic rats. Notes: Rats were administered with 1% DMN dissolved in saline (1 mL/kg body weight) by intraperitoneal injection for 3 consecutive days per week for 4 weeks to induce liver fibrosis. Bar graphs showing the serum level of SOD (A) and MDA (B) in rats received treatment of vehicle control, DMN alone, DMN +20 mg/kg UA, and DMN +40 mg/kg UA. Data are expressed as mean ± SD (n=5). ***P<0.001. Abbreviations: UA, ursolic acid; SOD, superoxide dismutase; MDA, maleic dialdehyde; DMN, dimethylnitrosamine; SD, standard deviation.
Figure 4
Figure 4
UA inhibits the proliferation of HSC-T6 cells. Notes: Leptin (100 ng/mL) stimulated HSC-T6 cells proliferation at 12 hours, 24 hours, and 48 hours. Leptin-induced HSC-T6 cell proliferation was significantly suppressed by the pretreatment with UA (50 µM), AG490 (50 µM), DPI (20 µM), or PD98059 (30 µM). Data are expressed as mean ± SD from six independent experiments. The symbol *indicates the comparison between leptin and other treatments, *P<0.001. Abbreviations: UA, ursolic acid; HSC, hepatic stellate cell; DPI, diphenyleneiodonium; SD, standard deviation.
Figure 5
Figure 5
UA inhibits leptin-induced ROS production in HSC-T6 cells. Notes: HSC-T6 cells were seeded into six-well plates and pretreated with vehicle control, UA (50 µM), NAC (10 mM), DPI (20 µM), or AG490 (50 µM) for 30 minutes. Then, the cells were stimulated by leptin (100 ng/mL), and the intracellular ROS level was measured using DCF-DA fluorescence probes (10 µM). (A) HSC-T6 cells were stimulated by leptin for 1 hour showing a significant induction in ROS production that was blocked by the pretreatment with UA, NAC, DPI, or AG490. (B) UA suppressed the leptin-induced ROS generation in a time-dependent manner and exhibited a similar inhibitory effect on ROS generation to DPI over 24 hours. Data are expressed as mean ± SD from six independent experiments. ***P<0.001. Abbreviations: UA, ursolic acid; ROS, reactive oxygen species; HSC, hepatic stellate cell; NAC, N-acetyl-L-cysteine; DPI, diphenyleneiodonium; DCF-DA, 2′,7′-dichlorofluorescin diacetate; SD, standard deviation.
Figure 6
Figure 6
UA suppressed leptin-induced NOX activation in HSC-T6 cells. Notes: Cells were pretreated for 30 minutes with UA (50 µM), NAC (10 mM), or AG490 (50 µM) and incubated for 1 hour, 12 hours, or 24 hours in the presence of leptin (100 ng/mL). Cells were detached by trypsinization and processed as described in the Materials and methods section. Data are expressed as mean ± SD from six independent experiments. ***P<0.01. Abbreviations: UA, ursolic acid; NOX, NADPH oxidase; HSC, hepatic stellate cell; NAC, N-acetyl-L-cysteine; SD, standard deviation.
Figure 7
Figure 7
UA suppressed leptin-induced translocation of the p47phox from cytoplasm to cell membrane in HSC-T6 cells. Notes: Cells were pretreated with UA (50 µM), DPI (20 µM), or AG490 (50 µM) for 30 minutes and then were stimulated by leptin (100 ng/mL) for another 30 minutes. The membrane bound and total level of p47phox were examined by Western blotting assay. (A) Representative blots of membrane (M-) p47phox and total (T-) p47phox in HSC-T6 cells. (B) Bar graph showing the relative level of M-p47phox in HSC-T6 cells. Data are expressed as mean ± SD from six independent experiments. β-Actin acts as an internal control. *P<0.05; **P<0.01. Abbreviations: UA, ursolic acid; HSC, hepatic stellate cell; DPI, diphenyleneiodonium; SD, standard deviation.
Figure 8
Figure 8
Effect of UA on the expression of NOX subunits of HSC-T6 cells. Notes: Cells were pretreated with UA (50 µM) for 30 minutes and then stimulated with leptin (100 ng/mL) for another 12 hours. The expression level of gp91phox, p22phox, p67phox, and Rac1 was examined using Western blotting assay. (A) Representative blots of gp91phox, p22phox, p67phox, and Rac1 in HSC-T6 cells. (B) Bar graphs showing the relative level of gp91phox, p22phox, p67phox, and Rac1 in HSC-T6 cells. Data are expressed as mean ± SD from six independent experiments. β-Actin acts as an internal control. **P<0.01; ***P<0.001. Abbreviations: UA, ursolic acid; NOX, NADPH oxidase; HSC, hepatic stellate cell; SD, standard deviation.
Figure 9
Figure 9
UA inhibits ERK signaling pathway in HSC-T6 cells. Notes: Cells were pretreated with UA (50 µM), DPI (20 µM), AG490 (50 µM), or PD98059 (30 µM) for 30 minutes and then stimulated with leptin (100 ng/mL) for 30 minutes. The phosphorylation level of ERK1/2 was examined using Western blotting assay. (A) Representative blots of p-ERK1/2 in HSC-T6 cells. (B) Bar graphs showing the relative level of p-ERK1 and p-ERK2 in HSC-T6 cells. Data are expressed as mean ± SD from six independent experiments. β-Actin acts as an internal control. *P<0.05; **P<0.01. Abbreviations: UA, ursolic acid; ERK, extracellular signal-regulated kinase; HSC, hepatic stellate cell; DPI, diphenyleneiodonium; SD, standard deviation.
Figure 10
Figure 10
UA inhibits p38 MAPK and PI3K/Akt signaling pathways in HSC-T6 cells. Notes: Cells were pretreated with UA (50 µM), DPI (20 µM), SB203580 (10 µM), or LY294002 (10 µM) for 30 minutes and then stimulated with leptin (100 ng/mL) for 30 minutes. The level of p-p38 MAPK, p38 MAPK, PI3K, p-Akt, and Akt was examined using Western blotting assay. (A) Representative blots of p-p38 MAPK, p38 MAPK, PI3K, p-Akt, and Akt in HSC-T6 cells. (B) Bar graphs showing the relative level of p-p38 MAPK, p38 MAPK, PI3K, p-Akt, and Akt in HSC-T6 cells. Data are expressed as mean ± SD from six independent experiments. β-Actin acts as an internal control. *P<0.05; ***P<0.001. + and − represent with or without treatment, respectively. Abbreviations: UA, ursolic acid; p38 MAPK, p38 mitogen-activated protein kinase; PI3K, phosphoinositide 3-kinase; HSC, hepatic stellate cell; DPI, diphenyleneiodonium; SD, standard deviation.
Figure 11
Figure 11
Effect of UA on the expression of TIMP-1 and MMP-1 in HSC-T6 cells. Notes: Cells were pretreated with UA (50 µM), DPI (20 µM), SB203580 (10 µM), or LY294002 (10 µM) for 30 minutes and then stimulated with leptin for another 24 hours. The expression level of TIMP-1 and MMP-1 was examined using Western blotting assays. (A) Representative blots of TIMP-1 and MMP-1 in HSC-T6 cells. (B) Bar graphs showing the relative level of TIMP-1 and MMP-1 in HSC-T6 cells. Data are expressed as mean ± SD from six independent experiments. β-Actin acts as an internal control. *P<0.05; ***P<0.001. + and − represent with or without treatment, respectively. Abbreviations: UA, ursolic acid; TIMP-1, TIMP metallopeptidase inhibitor 1; MMP-1, matrix metalloproteinase-1; HSC, hepatic stellate cell; DPI, diphenyleneiodonium; SD, standard deviation.
Figure 12
Figure 12
Effect of UA on the mRNA expression of collagen I in HSC-T6 cells. Notes: Cells were pretreated with UA (50 µM), DPI (20 µM), AG490 (50 µM), or PD98059 (30 µM) for 30 minutes and then stimulated with leptin (100 ng/mL) for another 24 hours. The mRNA expression level of type I collagen I was examined using PCR assays. (A) Representative blots of type I collagen I in HSC-T6 cells. (B) Bar graph showing the relative level of type I collagen I in HSC-T6 cells. Data are expressed as mean ± SD from six independent experiments. β-Actin acts as an internal control. *P<0.05; **P<0.01. + and − represent with or without treatment, respectively. Abbreviations: UA, ursolic acid; HSC, hepatic stellate cell; DPI, diphenyleneiodonium; PCR, polymerase chain reaction; SD, standard deviation.

Similar articles

Cited by

References

    1. Murphy SL, Xu J, Kochanek KD. Deaths: final data for 2010. Natl Vital Stat Rep. 2013;61(4):1–117. - PubMed
    1. Bataller R, Brenner DA. Liver fibrosis. J Clin Invest. 2005;115(2):209–218. - PMC - PubMed
    1. Mitchell AE, Colvin HM, Palmer Beasley R. Institute of Medicine recommendations for the prevention and control of hepatitis B and C. Hepatology. 2010;51(3):729–733. - PubMed
    1. Davis GL, Alter MJ, El-Serag H, Poynard T, Jennings LW. Aging of hepatitis C virus (HCV)-infected persons in the United States: a multiple cohort model of HCV prevalence and disease progression. Gastroenterology. 2010;138(2):e1–e6. - PubMed
    1. Liu J, Fan D. Hepatitis B in China. Lancet. 2007;369(9573):1582–1583. - PubMed

MeSH terms