Comparative Study
. 2016 Feb;21(2):178-88.
doi: 10.1038/mp.2015.128. Epub 2015 Sep 8.

Altered neuronal network and rescue in a human MECP2 duplication model

Affiliations
Comparative Study

Altered neuronal network and rescue in a human MECP2 duplication model

S Nageshappa et al. Mol Psychiatry. 2016 Feb.

Abstract

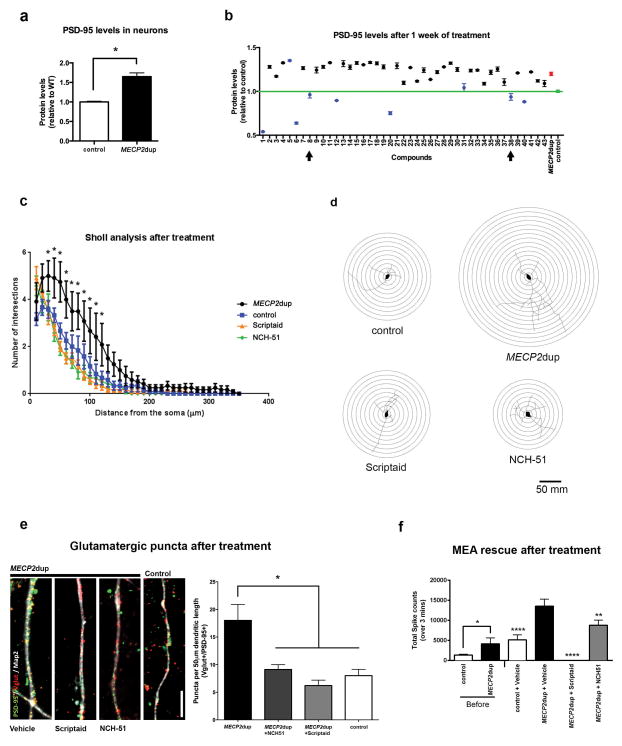
Increased dosage of methyl-CpG-binding protein-2 (MeCP2) results in a dramatic neurodevelopmental phenotype with onset at birth. We generated induced pluripotent stem cells (iPSCs) from patients with the MECP2 duplication syndrome (MECP2dup), carrying different duplication sizes, to study the impact of increased MeCP2 dosage in human neurons. We show that cortical neurons derived from these different MECP2dup iPSC lines have increased synaptogenesis and dendritic complexity. In addition, using multi-electrodes arrays, we show that neuronal network synchronization was altered in MECP2dup-derived neurons. Given MeCP2 functions at the epigenetic level, we tested whether these alterations were reversible using a library of compounds with defined activity on epigenetic pathways. One histone deacetylase inhibitor, NCH-51, was validated as a potential clinical candidate. Interestingly, this compound has never been considered before as a therapeutic alternative for neurological disorders. Our model recapitulates early stages of the human MECP2 duplication syndrome and represents a promising cellular tool to facilitate therapeutic drug screening for severe neurodevelopmental disorders.


Conflict of interest statement

The authors declare no conflict of interest.

Figures

Figure 1
Figure 1. Altered expression of neural progenitor genes in NPCs derived from MECP2dup iPSCs
a) Schematic representation of the duplication sizes for each patient (black line). The location of the MECP2 gene as well as other genes known to be involved in X-linked intellectual disability are shown (based on NCBI36/hg18). b) Immunofluorescence images of control and MECP2dup NPCs showing the expression of neural progenitor genes co-stained with either Nestin (day 20) or MAP-2 (day 30). Scale bar represents 20 μm. c) Transcript analysis of neural progenitor genes on control and MECP2dup NPCs by qRT-PCR during the course of differentiation (day 5 to day 30). Graphs show the average of three different biological replicates and are represented as fold difference compared to ‘day 5’ of control. Data is representative of mean ± s.e.m., n>3 independent differentiation experiments (t test, ***p < 0.001, *p < 0.05).
Figure 2
Figure 2. MECP2dup derived neurons exhibit modulation in cortical gene expression
a) Control and MECP2dup neurons were analyzed for the expression of cortical and synaptic genes over the course of differentiation by qRT-PCR. Data is represented as fold difference compared to ‘day 20’ of control cells. Data is representative of mean ± s.e.m., n>3 independent differentiation experiments (t test, ***p < 0.001, **p < 0.01, *p < 0.05). b) Expression by qRT-PCR of MECP2 in control and MECP2dup cells over the course of differentiation towards neurons. Data is representative of mean ± s.e.m., n>3 independent differentiation experiments (t test, ***p < 0.001, **p < 0.01, *p < 0.05). c) Western blotting analysis of MeCP2 protein in iPSCs, NPCs and neurons from control and MECP2dup samples. Protein extracts were prepared at days 0 (iPSCs), 20 (NPCs) and 60 (Neurons). GAPDH is shown as a protein loading control. d) Representative immunostaining images are shown of control and MECP2dup neurons at day 40 of differentiation showing the increased expression of cortical proteins. Cells are co-stained with either MAP2 or TUJ1. Scale bar represents 20 μm. e) Spontaneous neuronal activity and its inhibition by TTX treatment of cells plated on multi-electrode arrays (MEA), demonstrating the biological nature of the signal detected. The figure shows one representative channel of a control sample, before, during and after washout of TTX treatment. f) WGA experiment showing the proximity of neuronal connections in our neuronal network. White arrows point the cells to which WGA spread. Cells transduced with the WGA vector are shown in green (GFP reporter). Scale bar represents 40 μm.
Figure 3
Figure 3. MECP2dup cortical neurons exhibit increased synaptic gene expression and dendritic arborization
a) Puncta quantification of post- and pre-synaptic markers. The synaptic proteins VGlut1 (pre-synaptic) and PSD95 (post-synaptic) were used as markers and only co-localized puncta were quantified and graphed. Data is representative of mean ± s.e.m., n=3 independent differentiation experiments, * p = 0.0324, two-tailed t-test. Scale bar represents 10 μm. b) Western blotting analysis of synaptic proteins, synapsin and PSD95 as well as MeCP2 in total cell lysates of day 50 cortical neurons. MAP2 is used as a protein loading control. c) Sholl analysis of control and MECP2dup cortical neurons. Data is representative of mean ± s.e.m., n>3 independent differentiation experiments. For statistical significance, 125 control neurons and 80 MECP2dup neurons were considered for analysis (t test, ***p < 0.001, **p < 0.01, *p < 0.05). d) Left panel: representative high magnification confocal images of GFP-labeled neurons at day 70 in vitro from control and MECP2dup neurons. Scale bar represents 5 μm; Right panel: quantification of the total spine density and density of the mature and immature spines per dendritic section. Histograms represent the mean values ± s.e.m., * p = 0.02, *** p = 0.0003, Mann Whitney test. e) Western blotting analysis of Cux1 protein levels in MECP2dup NPCs compared to controls. Protein levels were quantified by Odyssey using 2 control cells lines and 3 MECP2dup cell lines. Data is representative of mean ± s.e.m., n=3 biological replicates for each cell line. Unpaired t test was used for statistics (****p < 0.0001). f) Association of MeCP2 with CUX1 promoter, BDNF exon 4 (positive control) or BDNF negative control was determined by ChIP assays with anti-MeCP2 antibody. Chromatin was isolated from 4 weeks MECP2dup neurons. Fold enrichment was quantified by qPCR. Histograms represent the mean ± s.e.m. Three biological with three or four technical repeats each. g) Quantification of the total number of synchronized bursts per 5 min interval present in at least 4 different channels. Data is representative of mean ± s.e.m. n=3 independent differentiation experiments. Unpaired t-test, ****p < 0.0001. h) Aligned raster plots of 5 representative channels for control and MECP2dup neurons on MEA. Spontaneous activity is shown for a total period of 200 s. i) Functional phenotype after overexpression and knockdown of MECP2 in control and MECP2dup neurons, respectively. Total spikes counts are shown, 1 week after virus transduction. GFP: overexpression control virus; MECP2: MECP2 overexpression virus; scramble: shRNA scramble virus; shMECP2: shRNA for MECP2 transcript. Unpaired t test used (*p = 0.012, **p = 0.0028). Bars represent mean ± s.e.m. Three independent differentiation experiments.
Figure 4
Figure 4. Electrophysiology network properties and morphological rescue of MeCP2dup neurons
a) InCell Western (ICW) in 50 days differentiated neurons for PSD95 reveals an up-regulation in patient cells. Protein levels are shown relative to controls. Data is representative of mean ± s.e.m., n=3 independent differentiation experiments. Unpaired t-test, *p = 0.0146. b) Compound library screening in 50 days differentiated neurons. Screen-Well Epigenetics library (Enzo) was used. The neurons were treated for one week before ICW. Green, control neurons PSD95 levels; Red, MECP2dup neurons PSD95 levels; Blue, treated neurons that had a p value <0.0001 when compared to untreated duplicated neurons. Control neurons had a p value <0.0001 when compared to untreated MECP2dup neurons. One-way ANOVA test used and bars represent ± s.e.m. Arrows indicate the compounds Scriptaid (compound 8) and NCH-51 (compound 38), selected to further investigation. c) Sholl analysis of control and patient neurons that were treated for 1 week with the indicated compounds. Data is representative of mean ± s.e.m., 3 independent differentiations experiments, 24 neurons counted on each condition (* p<0.05). d) Sholl analysis diagrams of representative neurons. Concentric circles have a distance of 10 μm between them. e) Puncta quantification of post- and pre-synaptic markers after treatment with epigenetic modifiers. The synaptic proteins Vglut1 (pre-synaptic) and PSD95 (post-synaptic) were used as markers and only co-localized puncta were quantified and graphed. Scale bar represents 10 μm. One-way ANOVA test used to represent data after treatment using Dunnett’s multiple comparison test and comparing to MECP2dup (*p < 0.05). p values per comparison: MECP2dup vs control = p < 0.05; MECP2dup vs MECP2dup + NCH-51 = p < 0.01; MECP2dup vs MECP2dup+Scriptaid = p < 0.0001. Bars represent mean ± s.e.m. Three independent differentiation experiments. f) Functional rescue after treatment with epigenetic modifiers; MEA was used to measure activity. Total spikes counts are shown before and after treatment with compounds. Unpaired t test used to compare control and MECP2dup data before treatment (*p = 0.0110). One-way ANOVA test used to represent data after treatment using Dunnett’s multiple comparison test comparing to MECP2dup+Vehicle (**p < 0.01, ****p < 0.0001). Bars represent mean ± s.e.m. Three independent differentiation experiments.

References

    1. Van Esch H, Bauters M, Ignatius J, Jansen M, Raynaud M, Hollanders K, et al. Duplication of the MECP2 region is a frequent cause of severe mental retardation and progressive neurological symptoms in males. Am J Hum Genet. 2005;77:442–453. - PMC - PubMed
    1. del Gaudio D, Fang P, Scaglia F, Ward PA, Craigen WJ, Glaze DG, et al. Increased MECP2 gene copy number as the result of genomic duplication in neurodevelopmentally delayed males. Genet Med. 2006;8:784–792. - PubMed
    1. Ramocki MB, Peters SU, Tavyev YJ, Zhang F, Carvalho CM, Schaaf CP, et al. Autism and other neuropsychiatric symptoms are prevalent in individuals with MeCP2 duplication syndrome. Ann Neurol. 2009;66:771–782. - PMC - PubMed
    1. Ramocki MB, Tavyev YJ, Peters SU. The MECP2 duplication syndrome. Am J Med Genet A. 2010;152A:1079–1088. - PMC - PubMed
    1. Van Esch H. MECP2 Duplication Syndrome. Mol Syndromol. 2012;2:128–136. - PMC - PubMed

Publication types

Substances