

The effect of synaptic plasticity on orientation selectivity in a balanced model of primary visual cortex
- PMID: 26347615
- PMCID: PMC4542321
- DOI: 10.3389/fncir.2015.00042
The effect of synaptic plasticity on orientation selectivity in a balanced model of primary visual cortex
Abstract
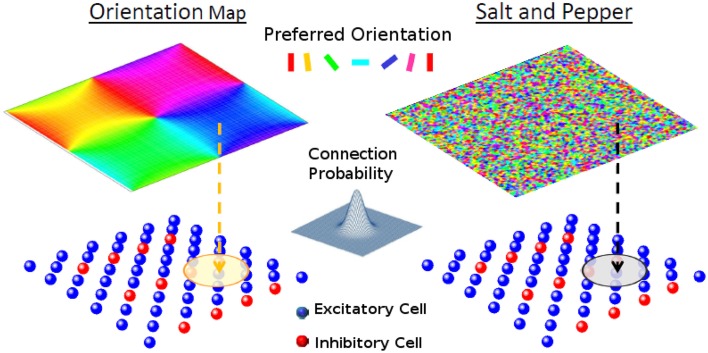
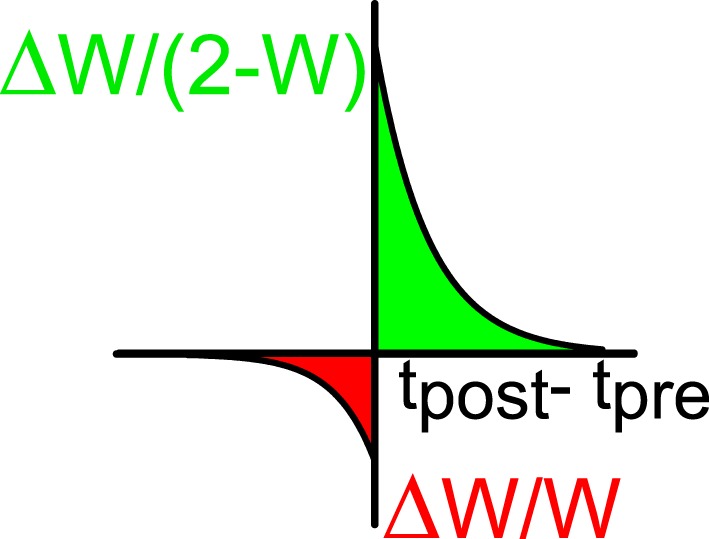
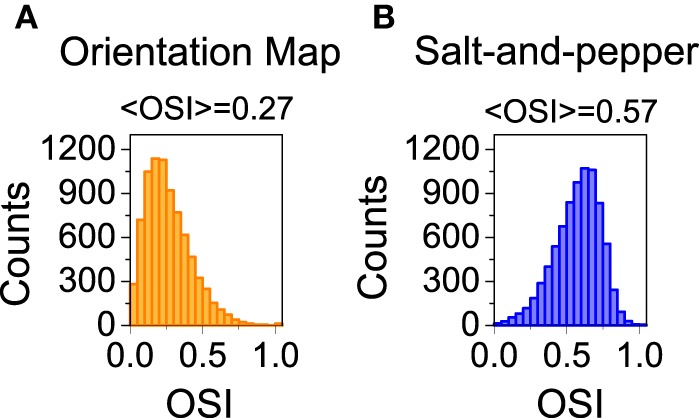
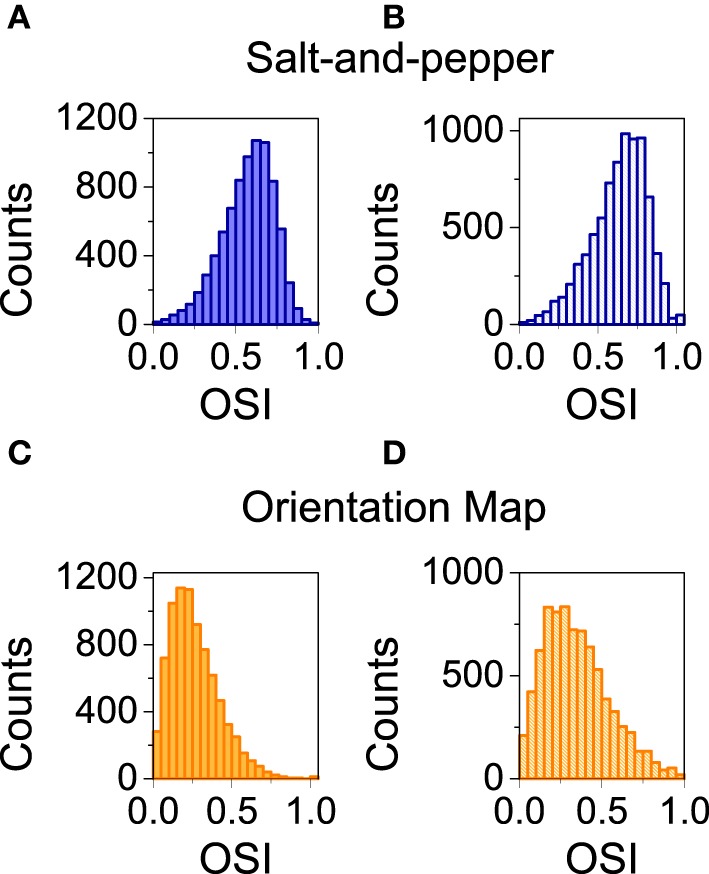
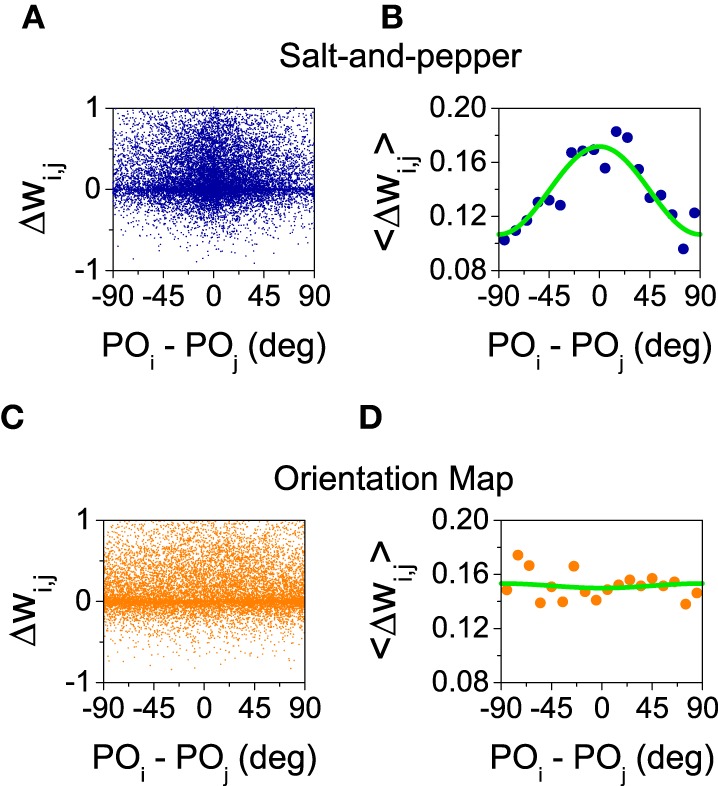
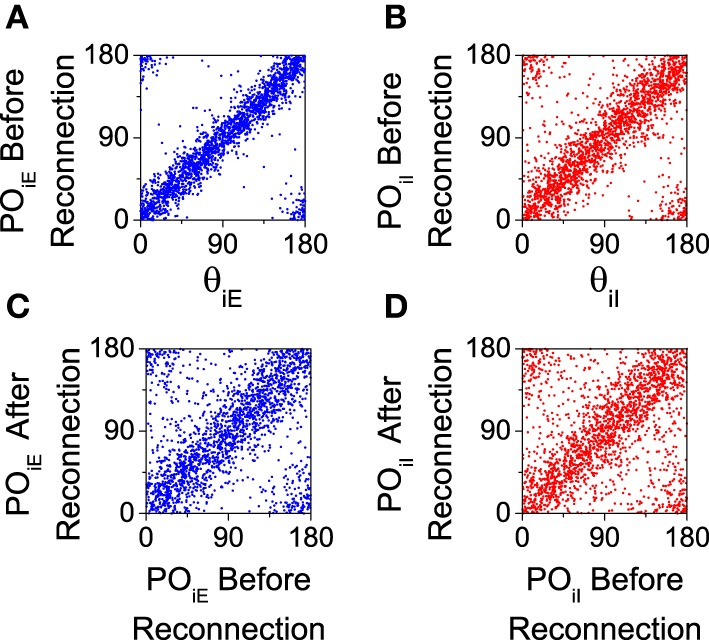
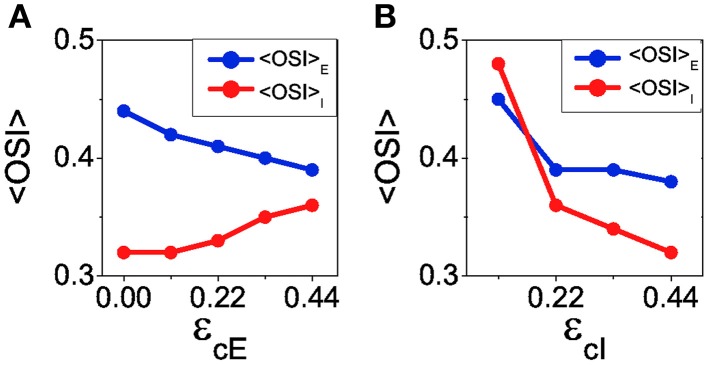
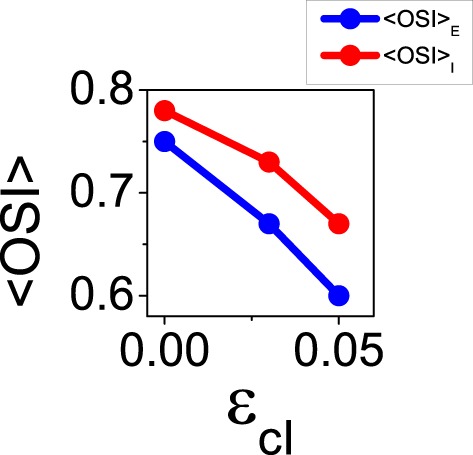
Orientation selectivity is ubiquitous in the primary visual cortex (V1) of mammals. In cats and monkeys, V1 displays spatially ordered maps of orientation preference. Instead, in mice, squirrels, and rats, orientation selective neurons in V1 are not spatially organized, giving rise to a seemingly random pattern usually referred to as a salt-and-pepper layout. The fact that such different organizations can sharpen orientation tuning leads to question the structural role of the intracortical connections; specifically the influence of plasticity and the generation of functional connectivity. In this work, we analyze the effect of plasticity processes on orientation selectivity for both scenarios. We study a computational model of layer 2/3 and a reduced one-dimensional model of orientation selective neurons, both in the balanced state. We analyze two plasticity mechanisms. The first one involves spike-timing dependent plasticity (STDP), while the second one considers the reconnection of the interactions according to the preferred orientations of the neurons. We find that under certain conditions STDP can indeed improve selectivity but it works in a somehow unexpected way, that is, effectively decreasing the modulated part of the intracortical connectivity as compared to the non-modulated part of it. For the reconnection mechanism we find that increasing functional connectivity leads, in fact, to a decrease in orientation selectivity if the network is in a stable balanced state. Both counterintuitive results are a consequence of the dynamics of the balanced state. We also find that selectivity can increase due to a reconnection process if the resulting connections give rise to an unstable balanced state. We compare these findings with recent experimental results.
Keywords: orientation map; orientation selectivity; plasticity; synaptic reconnection; visual cortex.
Figures
Similar articles
-
Bottom-up and top-down dynamics in visual cortex.Prog Brain Res. 2005;149:65-81. doi: 10.1016/S0079-6123(05)49006-8. Prog Brain Res. 2005. PMID: 16226577 Review.
-
Emergence of Functional Specificity in Balanced Networks with Synaptic Plasticity.PLoS Comput Biol. 2015 Jun 19;11(6):e1004307. doi: 10.1371/journal.pcbi.1004307. eCollection 2015 Jun. PLoS Comput Biol. 2015. PMID: 26090844 Free PMC article.
-
The mechanism of orientation selectivity in primary visual cortex without a functional map.J Neurosci. 2012 Mar 21;32(12):4049-64. doi: 10.1523/JNEUROSCI.6284-11.2012. J Neurosci. 2012. PMID: 22442071 Free PMC article.
-
Orientation selectivity of synaptic input to neurons in mouse and cat primary visual cortex.J Neurosci. 2011 Aug 24;31(34):12339-50. doi: 10.1523/JNEUROSCI.2039-11.2011. J Neurosci. 2011. PMID: 21865476 Free PMC article.
-
The dynamics of visual responses in the primary visual cortex.Prog Brain Res. 2007;165:21-32. doi: 10.1016/S0079-6123(06)65003-6. Prog Brain Res. 2007. PMID: 17925238 Review.
Cited by
-
Orientation selectivity properties for the affine Gaussian derivative and the affine Gabor models for visual receptive fields.J Comput Neurosci. 2025 Mar;53(1):61-98. doi: 10.1007/s10827-024-00888-w. Epub 2025 Jan 29. J Comput Neurosci. 2025. PMID: 39878929 Free PMC article.
References
MeSH terms
LinkOut - more resources
Full Text Sources
Other Literature Sources
Miscellaneous