Prepulse inhibition predicts spatial working memory performance in the inbred Roman high- and low-avoidance rats and in genetically heterogeneous NIH-HS rats: relevance for studying pre-attentive and cognitive anomalies in schizophrenia
- PMID: 26347624
- PMCID: PMC4539526
- DOI: 10.3389/fnbeh.2015.00213
Prepulse inhibition predicts spatial working memory performance in the inbred Roman high- and low-avoidance rats and in genetically heterogeneous NIH-HS rats: relevance for studying pre-attentive and cognitive anomalies in schizophrenia
Abstract
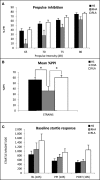
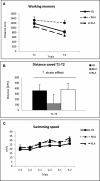
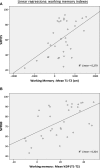
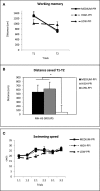
Animal models of schizophrenia-relevant symptoms are increasingly important for progress in our understanding of the neurobiological basis of the disorder and for discovering novel and more specific treatments. Prepulse inhibition (PPI) and working memory, which are impaired in schizophrenic patients, are among the symptoms/processes modeled in those animal analogs. We have evaluated whether a genetically-selected rat model, the Roman high-avoidance inbred strain (RHA-I), displays PPI deficits as compared with its Roman low-avoidance (RLA-I) counterpart and the genetically heterogeneous NIH-HS rat stock. We have investigated whether PPI deficits predict spatial working memory impairments (in the Morris water maze; MWM) in these three rat types (Experiment 1), as well as in a separate sample of NIH-HS rats stratified according to their extreme (High, Medium, Low) PPI scores (Experiment 2). The results from Experiment 1 show that RHA-I rats display PPI and spatial working memory deficits compared to both RLA-I and NIH-HS rats. Likewise, in Experiment 2, "Low-PPI" NIH-HS rats present significantly impaired working memory with respect to "Medium-PPI" and "High-PPI" NIH-HS subgroups. Further support to these results comes from correlational, factorial, and multiple regression analyses, which reveal that PPI is positively associated with spatial working memory performance. Conversely, cued learning in the MWM was not associated with PPI. Thus, using genetically-selected and genetically heterogeneous rats, the present study shows, for the first time, that PPI is a positive predictor of performance in a spatial working memory task. These results may have translational value for schizophrenia symptom research in humans, as they suggest that either by psychogenetic selection or by focusing on extreme PPI scores from a genetically heterogeneous rat stock, it is possible to detect a useful (perhaps "at risk") phenotype to study cognitive anomalies linked to schizophrenia.
Keywords: Roman high-avoidance rats; Roman low-avoidance rats; cognitive deficits; genetically heterogeneous rats; prepulse inhibition; schizophrenia-relevant symptoms; schizophreniform rat model; spatial working memory.
Figures


Similar articles
-
Increased exploratory activity in rats with deficient sensorimotor gating: a study of schizophrenia-relevant symptoms with genetically heterogeneous NIH-HS and Roman rat strains.Behav Processes. 2018 Jun;151:96-103. doi: 10.1016/j.beproc.2018.03.019. Epub 2018 Mar 19. Behav Processes. 2018. PMID: 29567400
-
Spatial learning in the genetically heterogeneous NIH-HS rat stock and RLA-I/RHA-I rats: revisiting the relationship with unconditioned and conditioned anxiety.Physiol Behav. 2015 May 15;144:15-25. doi: 10.1016/j.physbeh.2015.03.003. Epub 2015 Mar 5. Physiol Behav. 2015. PMID: 25747770
-
Low prepulse inhibition predicts lower social interaction, impaired spatial working memory, reference memory and cognitive flexibility in genetically heterogeneous rats.Physiol Behav. 2023 Nov 1;271:114355. doi: 10.1016/j.physbeh.2023.114355. Epub 2023 Sep 19. Physiol Behav. 2023. PMID: 37734470
-
Divergent stress responses and coping styles in psychogenetically selected Roman high-(RHA) and low-(RLA) avoidance rats: behavioural, neuroendocrine and developmental aspects.Stress. 2003 Jun;6(2):87-100. doi: 10.1080/1025389031000111320. Stress. 2003. PMID: 12775328 Review.
-
Neonatal handling and environmental enrichment effects on emotionality, novelty/reward seeking, and age-related cognitive and hippocampal impairments: focus on the Roman rat lines.Behav Genet. 1997 Nov;27(6):513-26. doi: 10.1023/a:1021400830503. Behav Genet. 1997. PMID: 9476360 Review.
Cited by
-
Quetiapine Ameliorates MIA-Induced Impairment of Sensorimotor Gating: Focus on Neuron-Microglia Communication and the Inflammatory Response in the Frontal Cortex of Adult Offspring of Wistar Rats.Cells. 2022 Sep 7;11(18):2788. doi: 10.3390/cells11182788. Cells. 2022. PMID: 36139363 Free PMC article.
-
Schizophrenia-like reduced sensorimotor gating in intact inbred and outbred rats is associated with decreased medial prefrontal cortex activity and volume.Neuropsychopharmacology. 2019 Oct;44(11):1975-1984. doi: 10.1038/s41386-019-0392-x. Epub 2019 Apr 16. Neuropsychopharmacology. 2019. PMID: 30986819 Free PMC article.
-
Comparative Analysis of Gene Expression Profiles Involved in Calcium Signaling Pathways Using the NLVH Animal Model of Schizophrenia.J Mol Neurosci. 2018 Jan;64(1):111-116. doi: 10.1007/s12031-017-1013-y. Epub 2017 Dec 6. J Mol Neurosci. 2018. PMID: 29214423
-
Serum Response Factor (SRF) Ablation Interferes with Acute Stress-Associated Immediate and Long-Term Coping Mechanisms.Mol Neurobiol. 2017 Dec;54(10):8242-8262. doi: 10.1007/s12035-016-0300-x. Epub 2016 Dec 2. Mol Neurobiol. 2017. PMID: 27914009
-
Working memory processes and the histamine-3 receptor in schizophrenia: a [11C]MK-8278 PET-fMRI study.Psychopharmacology (Berl). 2025 Jun;242(6):1321-1334. doi: 10.1007/s00213-024-06730-6. Epub 2024 Dec 22. Psychopharmacology (Berl). 2025. PMID: 39710764 Free PMC article.
References
-
- Baud A., Flint J., Fernández-Teruel A., The Rat Genome Sequencing Mapping Consortium (2014b). Identification of genetic variants underlying anxiety and multiple sclerosis in heterogeneous stock rats. World J. Neurosci. 4, 216–224. 10.4236/wjns.2014.43025 - DOI
LinkOut - more resources
Full Text Sources
Other Literature Sources

