

Genetic and Diet-Induced Obesity Increased Intestinal Tumorigenesis in the Double Mutant Mouse Model Multiple Intestinal Neoplasia X Obese via Disturbed Glucose Regulation and Inflammation
- PMID: 26347815
- PMCID: PMC4546984
- DOI: 10.1155/2015/343479
Genetic and Diet-Induced Obesity Increased Intestinal Tumorigenesis in the Double Mutant Mouse Model Multiple Intestinal Neoplasia X Obese via Disturbed Glucose Regulation and Inflammation
Erratum in
-
Corrigendum to "Genetic and Diet-Induced Obesity Increased Intestinal Tumorigenesis in the Double Mutant Mouse Model Multiple Intestinal Neoplasia X Obese via Disturbed Glucose Regulation and Inflammation".J Obes. 2016;2016:2361290. doi: 10.1155/2016/2361290. Epub 2016 Mar 2. J Obes. 2016. PMID: 27088011 Free PMC article.
Abstract
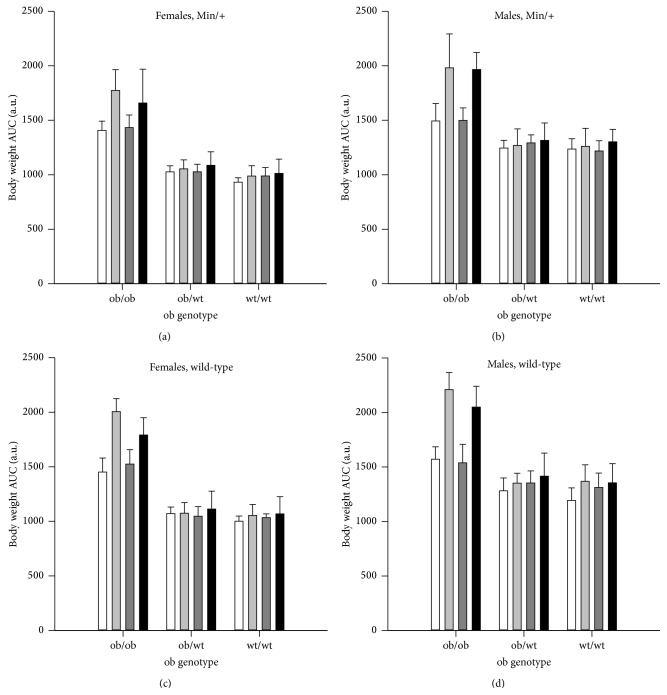
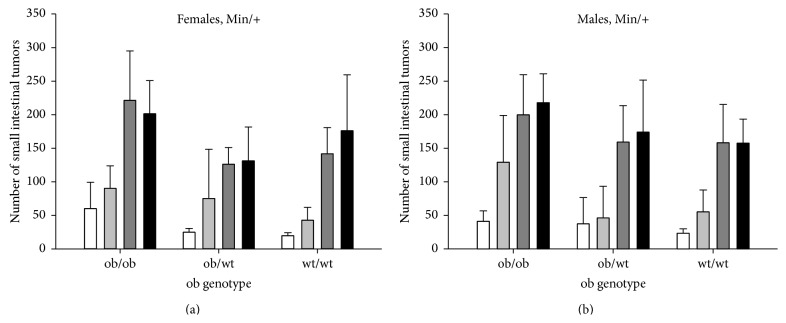
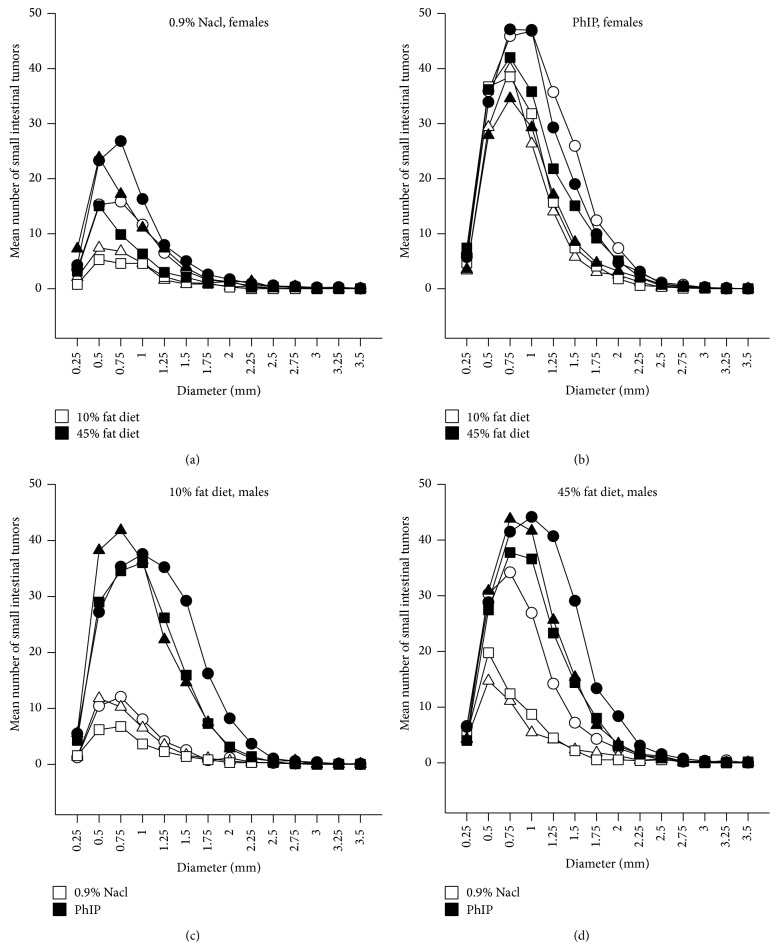
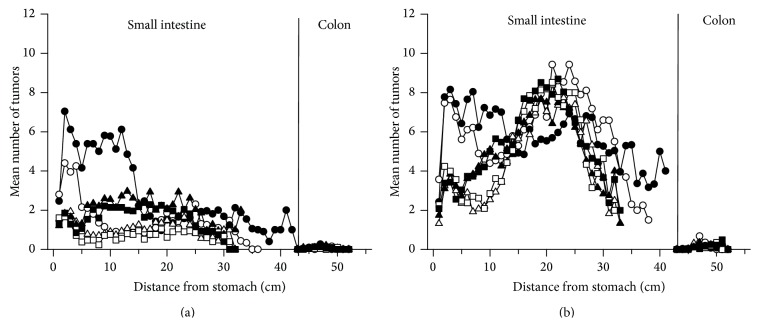
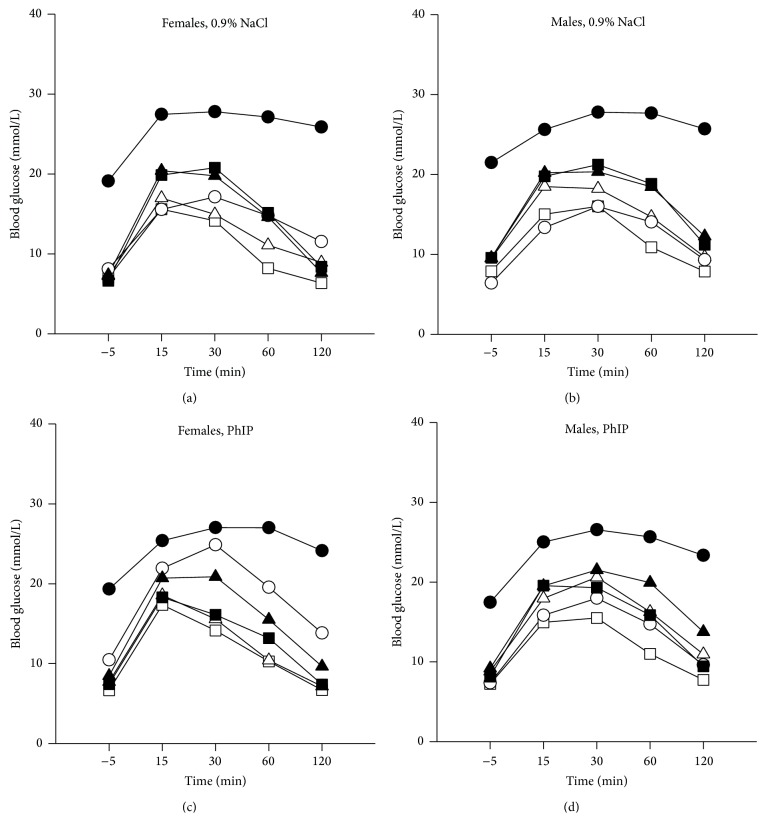
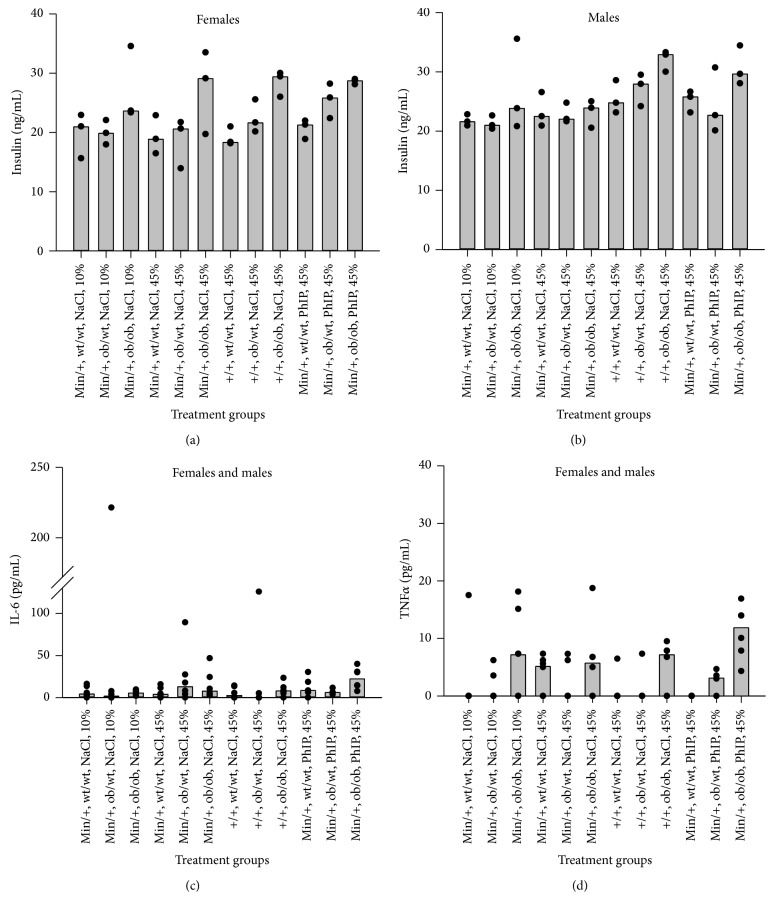
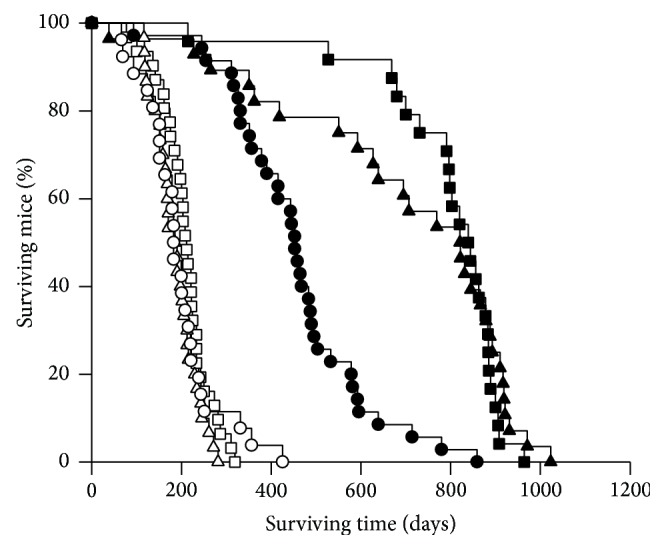
We have studied how spontaneous or carcinogen-induced intestinal tumorigenesis was affected by genetic or diet-induced obesity in C57BL/6J-Apc (Min/+) X C57BL/6J-Lep (ob/+) mice. Obesity was induced by the obese (ob) mutation in the lep gene coding for the hormone leptin, or by a 45% fat diet. The effects of obesity were examined on spontaneous intestinal tumors caused by the multiple intestinal neoplasia (Min) mutation in the adenomatous polyposis coli (Apc) gene and on tumors induced by the dietary carcinogen 2-amino-1-methyl-6-phenylimidazo[4,5-b]pyridine (PhIP). F1 ob/ob (homozygous mutated) mice had increased body weight (bw) and number of spontaneous and PhIP-induced small intestinal tumors (in Apc (Min/+) mice), versus ob/wt (heterozygous mutated) and wt/wt mice (homozygous wild-type). A 45% fat diet exacerbated bw and spontaneous tumor numbers versus 10% fat, but not PhIP-induced tumors. Except for bw, ob/wt and wt/wt were not significantly different. The obesity caused hyperglucosemia and insulinemia in ob/ob mice. A 45% fat diet further increased glucose, but not insulin. Inflammation was seen as increased TNFα levels in ob/ob mice. Thus the results implicate disturbed glucose regulation and inflammation as mechanisms involved in the association between obesity and intestinal tumorigenesis. Ob/ob mice had shorter lifespan than ob/wt and wt/wt mice.
Figures
Similar articles
-
Role of nucleotide excision repair deficiency in intestinal tumorigenesis in multiple intestinal neoplasia (Min) mice.Mutat Res. 2006 Dec 10;611(1-2):71-82. doi: 10.1016/j.mrgentox.2006.07.004. Epub 2006 Sep 8. Mutat Res. 2006. PMID: 16962818
-
Obesity promotes PhIP-induced small intestinal carcinogenesis in hCYP1A-db/db mice: involvement of mutations and DNA hypermethylation of Apc.Carcinogenesis. 2016 Jul;37(7):723-730. doi: 10.1093/carcin/bgw054. Epub 2016 May 2. Carcinogenesis. 2016. PMID: 27207656 Free PMC article.
-
Intestinal tumours induced by the food carcinogen 2-amino-1-methyl-6-phenylimidazo[4,5-b]pyridine in multiple intestinal neoplasia mice have truncation mutations as well as loss of the wild-type Apc(+) allele.Mutagenesis. 2001 Jul;16(4):309-15. doi: 10.1093/mutage/16.4.309. Mutagenesis. 2001. PMID: 11420398
-
Vitamin D and the nutritional environment in functions of intestinal stem cells: Implications for tumorigenesis and prevention.J Steroid Biochem Mol Biol. 2020 Apr;198:105556. doi: 10.1016/j.jsbmb.2019.105556. Epub 2019 Nov 26. J Steroid Biochem Mol Biol. 2020. PMID: 31783155 Free PMC article. Review.
-
Application of the Apc(Min/+) mouse model for studying inflammation-associated intestinal tumor.Biomed Pharmacother. 2015 Apr;71:216-21. doi: 10.1016/j.biopha.2015.02.023. Epub 2015 Feb 24. Biomed Pharmacother. 2015. PMID: 25960239 Review.
Cited by
-
Obesity and cancer: inflammation bridges the two.Curr Opin Pharmacol. 2016 Aug;29:77-89. doi: 10.1016/j.coph.2016.07.005. Epub 2016 Jul 16. Curr Opin Pharmacol. 2016. PMID: 27429211 Free PMC article. Review.
-
Host Genetics Background Affects Intestinal Cancer Development Associated with High-Fat Diet-Induced Obesity and Type 2 Diabetes.Cells. 2024 Oct 31;13(21):1805. doi: 10.3390/cells13211805. Cells. 2024. PMID: 39513912 Free PMC article.
-
Lower tumorigenesis without life extension in rats receiving lifelong deep ocean minerals.Cancer Med. 2020 Jun;9(11):3964-3973. doi: 10.1002/cam4.3028. Epub 2020 Apr 3. Cancer Med. 2020. PMID: 32243710 Free PMC article.
-
Morbid Obesity and Thyroid Cancer Rate. A Review of Literature.J Clin Med. 2021 Apr 27;10(9):1894. doi: 10.3390/jcm10091894. J Clin Med. 2021. PMID: 33925549 Free PMC article. Review.
-
4-Nitroquinoline 1-Oxide-Induced Tongue and Esophagus Carcinogenesis in Obese and Diabetic TSOD Mice.World J Oncol. 2017 Aug;8(4):97-104. doi: 10.14740/wjon1038w. Epub 2017 Aug 27. World J Oncol. 2017. PMID: 29147443 Free PMC article.
References
-
- The Organisation for Economic Co-operation and Development (OECD) Health at a Glance 2013, OECD Indicators. OECD; 2013. http://www.oecd.org/els/health-systems/Health-at-a-Glance-2013.pdf.
-
- Cancer Registry of Norway. Cancer in Norway 2012. Cancer Incidence, Mortality, Survival and Prevalence in Norway. Oslo, Norway: Cancer Registry of Norway; 2014. http://www.kreftregisteret.no/Global/Cancer%20in%20Norway/2012/CIN_2012.pdf.
-
- Boman B. M., Fields J. Z. An APC:WNT counter-current-like mechanism regulates cell division along the human colonic crypt axis: a mechanism that explains how APC mutations induce proliferative abnormalities that drive colon cancer development. Frontiers in Oncology. 2013;3 doi: 10.3389/fonc.2013.00244.244 - DOI - PMC - PubMed
Publication types
MeSH terms
Substances
LinkOut - more resources
Full Text Sources
Other Literature Sources
Molecular Biology Databases
Miscellaneous
