

Polysaccharides from Enteromorpha prolifera Improve Glucose Metabolism in Diabetic Rats
- PMID: 26347892
- PMCID: PMC4546985
- DOI: 10.1155/2015/675201
Polysaccharides from Enteromorpha prolifera Improve Glucose Metabolism in Diabetic Rats
Abstract
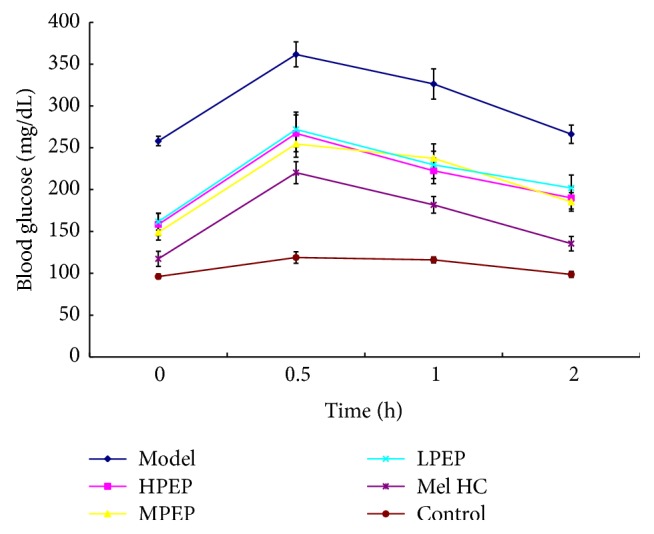
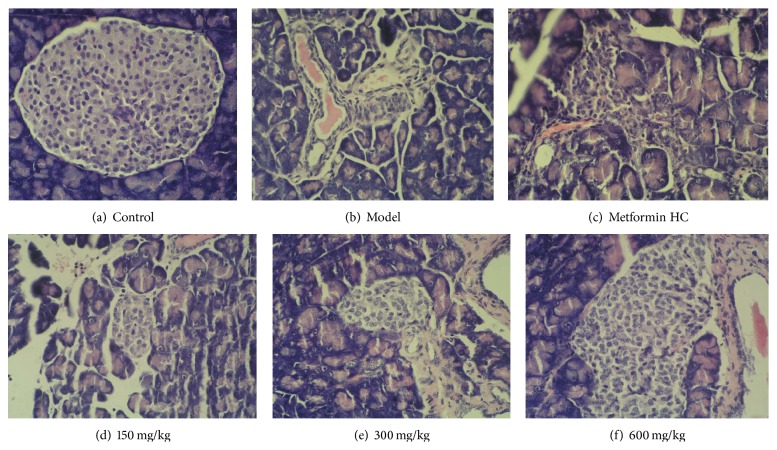
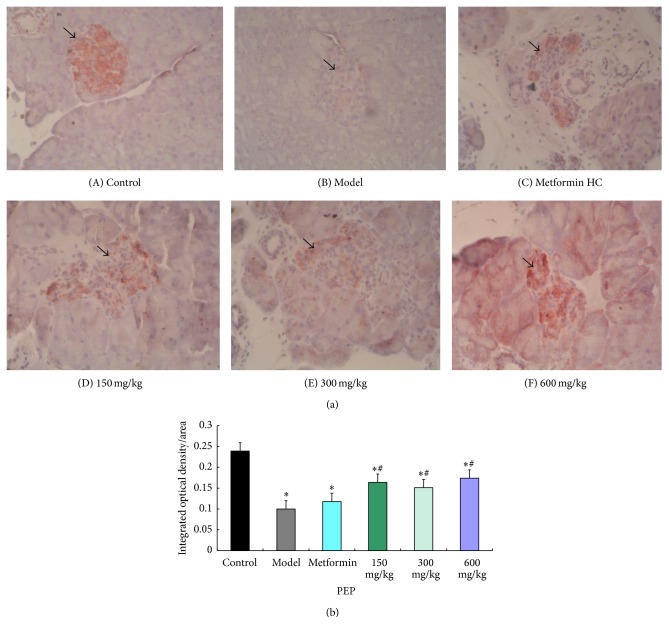
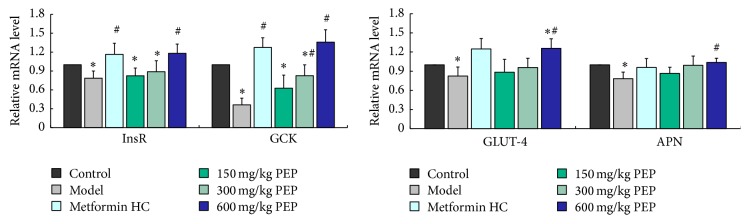
This study investigated the effects of polysaccharides from Enteromorpha prolifera (PEP) on glucose metabolism in a rat model of diabetes mellitus (DM). PEP (0, 150, 300, and 600 mg/kg) was administered intragastrically to rats for four weeks. After treatment, fasting blood glucose (FBG) and insulin (INS) levels were measured, and the insulin sensitivity index (ISI) was calculated. The morphopathological changes in the pancreas were observed. Serum samples were collected to measure the oxidant-antioxidant status. The mRNA expression levels of glucokinase (GCK) and insulin receptor (InsR) in liver tissue and glucose transporter type 4 (GLUT-4) and adiponectin (APN) in adipose tissue were determined. Compared with the model group, the FBG and INS levels were lower, the ISI was higher, and the number of islet β-cells was significantly increased in all the PEP groups. In the medium- and high-dose PEP groups, MDA levels decreased, and the enzymatic activities of SOD and GSH-Px increased. The mRNA expression of InsR and GCK increased in all the PEP groups; APN mRNA expression increased in the high-dose PEP group, and GLUT-4 mRNA expression increased in adipose tissue. These findings suggest that PEP is a potential therapeutic agent that can be utilized to treat DM.
Figures
Similar articles
-
The hypoglycemic effect of the kelp on diabetes mellitus model induced by alloxan in rats.Int J Mol Sci. 2012;13(3):3354-3365. doi: 10.3390/ijms13033354. Epub 2012 Mar 12. Int J Mol Sci. 2012. PMID: 22489155 Free PMC article.
-
Effects of Chinese Fructus Mume formula and its separated prescription extract on insulin resistance in type 2 diabetic rats.J Huazhong Univ Sci Technolog Med Sci. 2013 Dec;33(6):877-885. doi: 10.1007/s11596-013-1215-7. Epub 2013 Dec 13. J Huazhong Univ Sci Technolog Med Sci. 2013. PMID: 24337852
-
Antihyperglycemic and antioxidative effects of new herbal formula in streptozotocin-induced diabetic rats.J Med Food. 2009 Aug;12(4):728-35. doi: 10.1089/jmf.2008.1195. J Med Food. 2009. PMID: 19735171
-
Antihyperglycemic, antihyperlipidemic and antioxidant effects of ethanol and aqueous extracts of Cyclocarya paliurus leaves in type 2 diabetic rats.J Ethnopharmacol. 2013 Dec 12;150(3):1119-27. doi: 10.1016/j.jep.2013.10.040. Epub 2013 Oct 30. J Ethnopharmacol. 2013. PMID: 24184190
-
Effects of a Novel Glucokinase Activator, HMS5552, on Glucose Metabolism in a Rat Model of Type 2 Diabetes Mellitus.J Diabetes Res. 2017;2017:5812607. doi: 10.1155/2017/5812607. Epub 2017 Jan 16. J Diabetes Res. 2017. PMID: 28191470 Free PMC article.
Cited by
-
Anti-Diabetic Effects and Mechanisms of Dietary Polysaccharides.Molecules. 2019 Jul 13;24(14):2556. doi: 10.3390/molecules24142556. Molecules. 2019. PMID: 31337059 Free PMC article. Review.
-
Immunomodulatory Effects of a Low-Molecular Weight Polysaccharide from Enteromorpha prolifera on RAW 264.7 Macrophages and Cyclophosphamide- Induced Immunosuppression Mouse Models.Mar Drugs. 2020 Jun 28;18(7):340. doi: 10.3390/md18070340. Mar Drugs. 2020. PMID: 32605327 Free PMC article.
-
Microbiome-metabolome analysis reveals alterations in the composition and metabolism of caecal microbiota and metabolites with dietary Enteromorpha polysaccharide and Yeast glycoprotein in chickens.Front Immunol. 2022 Oct 13;13:996897. doi: 10.3389/fimmu.2022.996897. eCollection 2022. Front Immunol. 2022. PMID: 36311785 Free PMC article.
-
Extraction Techniques, Biological Activities and Health Benefits of Marine Algae Enteromorpha prolifera Polysaccharide.Front Nutr. 2021 Oct 7;8:747928. doi: 10.3389/fnut.2021.747928. eCollection 2021. Front Nutr. 2021. PMID: 34692752 Free PMC article. Review.
-
Ethanol Extract from Ulva prolifera Prevents High-Fat Diet-Induced Insulin Resistance, Oxidative Stress, and Inflammation Response in Mice.Biomed Res Int. 2018 Jan 3;2018:1374565. doi: 10.1155/2018/1374565. eCollection 2018. Biomed Res Int. 2018. PMID: 29511669 Free PMC article.
References
-
- Titov V. N. Phylogenesis, etiology and pathogenesis of insulin resistance. Differences from type II diabetes mellitus. Vestnik Rossiiskoi Akademii Meditsinskikh Nauk. 2012;(4):65–73. - PubMed
-
- Sharpatyi V. A. Radiochemistry of polysaccharides (review) Radiatsionnaia Biologiia, Radioecologiia. 1999;39(1):156–161. - PubMed
Publication types
MeSH terms
Substances
LinkOut - more resources
Full Text Sources
Other Literature Sources
Medical
Miscellaneous
