. 2016 Feb;278(2):546-53.
doi: 10.1148/radiol.2015150358. Epub 2015 Sep 4.

Prognostic Imaging Biomarkers in Glioblastoma: Development and Independent Validation on the Basis of Multiregion and Quantitative Analysis of MR Images

Affiliations

Prognostic Imaging Biomarkers in Glioblastoma: Development and Independent Validation on the Basis of Multiregion and Quantitative Analysis of MR Images

Yi Cui et al. Radiology. 2016 Feb.

Abstract

Purpose: To develop and independently validate prognostic imaging biomarkers for predicting survival in patients with glioblastoma on the basis of multiregion quantitative image analysis.

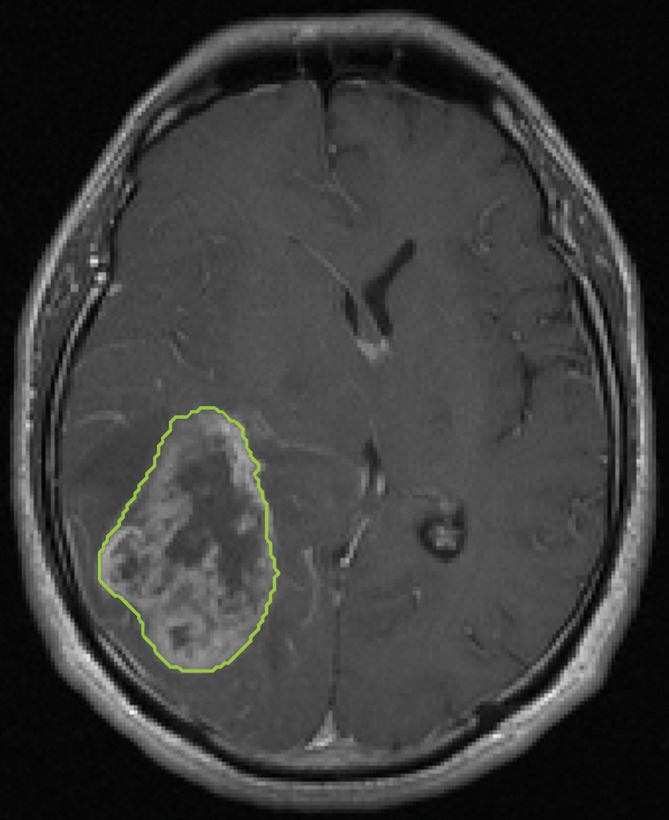
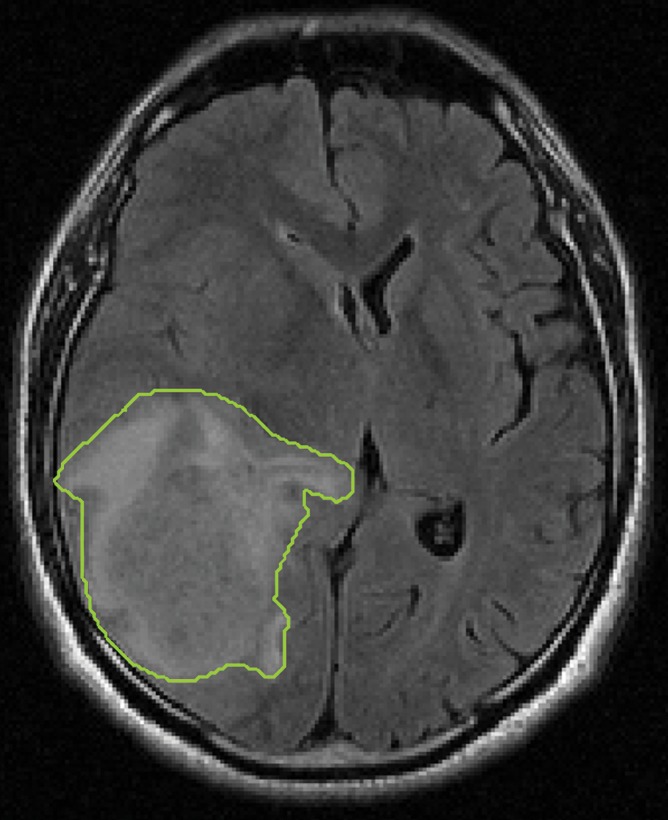
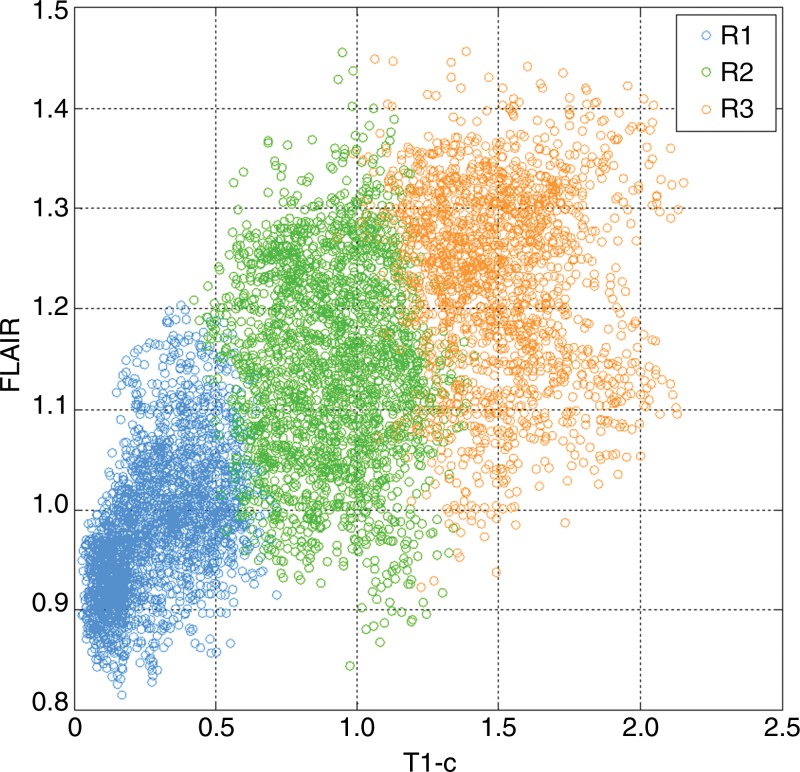
Materials and methods: This retrospective study was approved by the local institutional review board, and informed consent was waived. A total of 79 patients from two independent cohorts were included. The discovery and validation cohorts consisted of 46 and 33 patients with glioblastoma from the Cancer Imaging Archive (TCIA) and the local institution, respectively. Preoperative T1-weighted contrast material-enhanced and T2-weighted fluid-attenuation inversion recovery magnetic resonance (MR) images were analyzed. For each patient, we semiautomatically delineated the tumor and performed automated intratumor segmentation, dividing the tumor into spatially distinct subregions that demonstrate coherent intensity patterns across multiparametric MR imaging. Within each subregion and for the entire tumor, we extracted quantitative imaging features, including those that fully capture the differential contrast of multimodality MR imaging. A multivariate sparse Cox regression model was trained by using TCIA data and tested on the validation cohort.

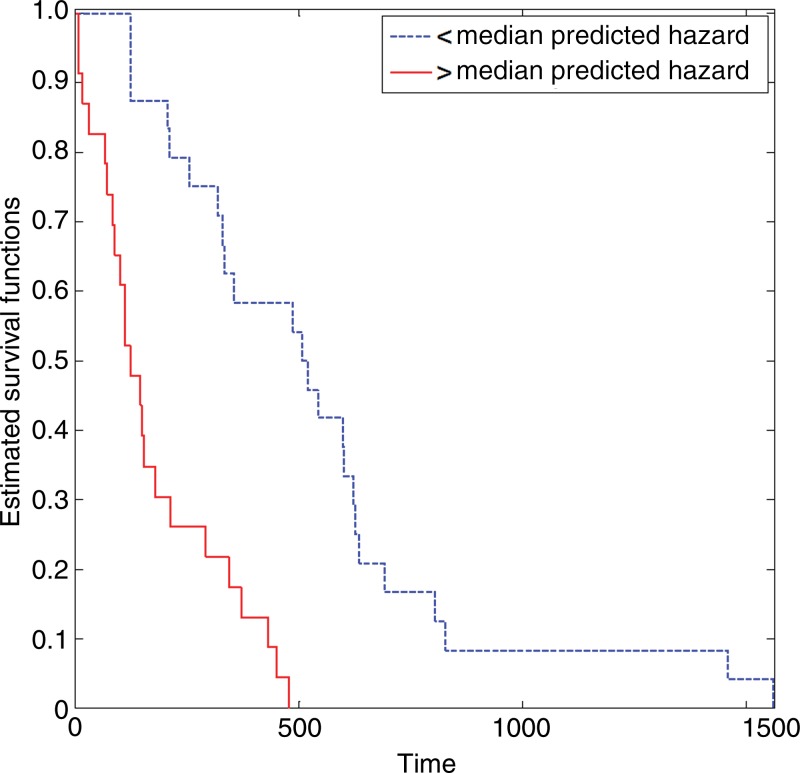
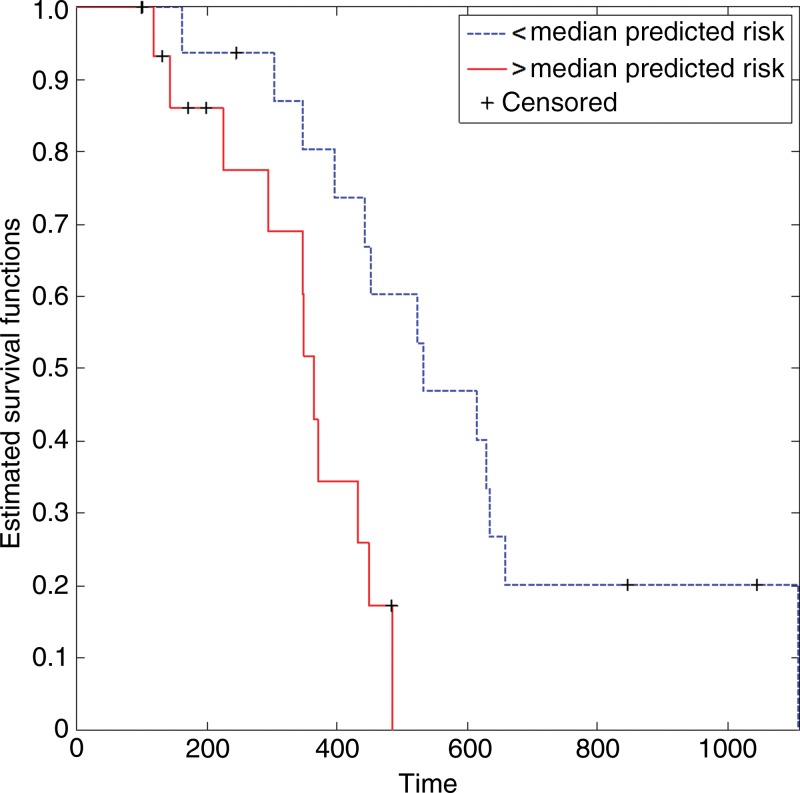
Results: The optimal prognostic model identified five imaging biomarkers that quantified tumor surface area and intensity distributions of the tumor and its subregions. In the validation cohort, our prognostic model achieved a concordance index of 0.67 and significant stratification of overall survival by using the log-rank test (P = .018), which outperformed conventional prognostic factors, such as age (concordance index, 0.57; P = .389) and tumor volume (concordance index, 0.59; P = .409).

Conclusion: The multiregion analysis presented here establishes a general strategy to effectively characterize intratumor heterogeneity manifested at multimodality imaging and has the potential to reveal useful prognostic imaging biomarkers in glioblastoma.


Figures

Figure 1a:
Figure 1a:
Segmentation of the delineated tumor. Delineation results in creation of (a) postcontrast T1-weighted and (b) FLAIR images. (c) Color-coded image shows tumor and peripheral nonenhancing regions. (d) Color-coded image shows the result of intratumor segmentation. Blue areas = hypointense to mildly hyperintense, green areas = moderately hyperintense, orange areas = strongly hyperintense.
Figure 1b:
Figure 1b:
Segmentation of the delineated tumor. Delineation results in creation of (a) postcontrast T1-weighted and (b) FLAIR images. (c) Color-coded image shows tumor and peripheral nonenhancing regions. (d) Color-coded image shows the result of intratumor segmentation. Blue areas = hypointense to mildly hyperintense, green areas = moderately hyperintense, orange areas = strongly hyperintense.
Figure 1c:
Figure 1c:
Segmentation of the delineated tumor. Delineation results in creation of (a) postcontrast T1-weighted and (b) FLAIR images. (c) Color-coded image shows tumor and peripheral nonenhancing regions. (d) Color-coded image shows the result of intratumor segmentation. Blue areas = hypointense to mildly hyperintense, green areas = moderately hyperintense, orange areas = strongly hyperintense.
Figure 1d:
Figure 1d:
Segmentation of the delineated tumor. Delineation results in creation of (a) postcontrast T1-weighted and (b) FLAIR images. (c) Color-coded image shows tumor and peripheral nonenhancing regions. (d) Color-coded image shows the result of intratumor segmentation. Blue areas = hypointense to mildly hyperintense, green areas = moderately hyperintense, orange areas = strongly hyperintense.
Figure 2:
Figure 2:
Graph shows the distributions of postcontrast T1-weighted and FLAIR signal intensity within a tumor, with each voxel color-coded by the subregion to which it belongs according to intratumor segmentation. Regions are ordered by their mean T1-weighted postcontrast signal intensity level. Blue = low signal intensity, green = medium signal intensity, orange = high signal intensity.
Figure 3:
Figure 3:
Graph shows Kaplan-Meier survival estimates for the training TCIA cohort, which were determined with the log-rank test (P < .0001; hazard ratio, 0.743).
Figure 4:
Figure 4:
Graph shows Kaplan-Meier survival estimates for the independent validation cohort, which were determined with the log-rank test (P = .018; hazard ratio, 0.240).

References

    1. Louis DN, Ohgaki H, Wiestler OD, et al. . The 2007 WHO classification of tumours of the central nervous system. Acta Neuropathol (Berl) 2007;114(2):97–109. - PMC - PubMed
    1. Dolecek TA, Propp JM, Stroup NE, Kruchko C. CBTRUS statistical report: primary brain and central nervous system tumors diagnosed in the United States in 2005–2009. Neuro-oncol 2012;14(Suppl 5):v1–v49. - PMC - PubMed
    1. Stupp R, Mason WP, van den Bent MJ, et al. . Radiotherapy plus concomitant and adjuvant temozolomide for glioblastoma. N Engl J Med 2005;352(10):987–996. - PubMed
    1. Bonavia R, Inda MM, Cavenee WK, Furnari FB. Heterogeneity maintenance in glioblastoma: a social network. Cancer Res 2011;71(12):4055–4060. - PMC - PubMed
    1. Sottoriva A, Spiteri I, Piccirillo SG, et al. . Intratumor heterogeneity in human glioblastoma reflects cancer evolutionary dynamics. Proc Natl Acad Sci U S A 2013;110(10):4009–4014. - PMC - PubMed

Publication types

MeSH terms

LinkOut - more resources