. 2015 Dec;156(12):4426-36.
doi: 10.1210/en.2015-1516. Epub 2015 Sep 8.

Circadian Disruption and Diet-Induced Obesity Synergize to Promote Development of β-Cell Failure and Diabetes in Male Rats

Affiliations

Circadian Disruption and Diet-Induced Obesity Synergize to Promote Development of β-Cell Failure and Diabetes in Male Rats

Jingyi Qian et al. Endocrinology. 2015 Dec.

Abstract

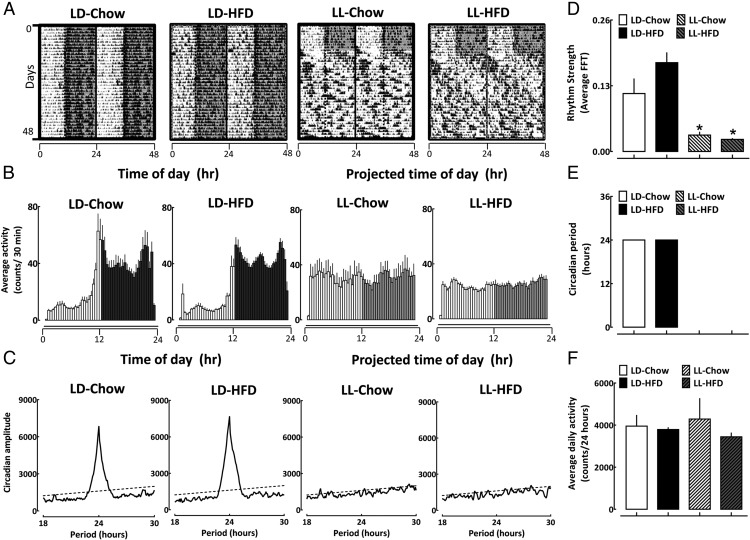
There are clear epidemiological associations between circadian disruption, obesity, and pathogenesis of type 2 diabetes. The mechanisms driving these associations are unclear. In the current study, we hypothesized that continuous exposure to constant light (LL) compromises pancreatic β-cell functional and morphological adaption to diet-induced obesity leading to development of type 2 diabetes. To address this hypothesis, we studied wild type Sprague Dawley as well as Period-1 luciferase reporter transgenic rats (Per1-Luc) for 10 weeks under standard light-dark cycle (LD) or LL with concomitant ad libitum access to either standard chow or 60% high-fat diet (HFD). Exposure to HFD led to a comparable increase in food intake, body weight, and adiposity in both LD- and LL-treated rats. However, LL rats displayed profound loss of behavioral circadian rhythms as well as disrupted pancreatic islet clock function characterized by the impairment in the amplitude and the phase islet clock oscillations. Under LD cycle, HFD did not adversely alter diurnal glycemia, diurnal insulinemia, β-cell secretory function as well as β-cell survival, indicating successful adaptation to increased metabolic demand. In contrast, concomitant exposure to LL and HFD resulted in development of hyperglycemia characterized by loss of diurnal changes in insulin secretion, compromised β-cell function, and induction of β-cell apoptosis. This study suggests that circadian disruption and diet-induced obesity synergize to promote development of β-cell failure, likely mediated as a consequence of impaired islet clock function.


Figures

Figure 1.
Figure 1.
Induction of diet-induced obesity in rats exposed to LD or LL. A, A diagram of experimental design and timeline. Mean body mass gain (B), daily caloric intake (C), daily fat intake (D), and mass of epididymal fat depots (E) in rats exposed for 10 weeks to standard LD cycle on chow diet (LD-Chow, open bars; n = 11), 2) LD cycle on 60% HFD (LD-HFD, black bars; n = 15), 3) LL cycle on chow (LL-Chow, open striped bars; n = 8), and 4) LL cycle on HFD (LL-HFD, shaded striped bars; n = 15). Bar graphs represent mean ± SEM. *, P < .05 vs LD-Chow and LL-Chow; †, P < .05 vs LD-Chow and LL-Chow.
Figure 2.
Figure 2.
Induction of circadian disruption in rats exposed to LD or LL fed either regular chow or HFD. A, Representative behavioral profiles of gross motor activity in rats (double plotted) monitored for 1 week at baseline under standard LD cycle fed regular chow diet followed by 6 weeks of recordings in LD-Chow, LD-HFD, LL-Chow, or LL-HFD. Shaded areas represent periods of dark. Temporal profiles are presented corresponding to “time of day (h)” and “projected time of day (h)” for activity data in LD- and LL-treated rats, respectively. B, Mean circadian activity (expressed as counts/30 min) shown across the 24-hour day in rats exposed for 10 weeks to LD-Chow, LD-HFD, LL-Chow, or LL-HFD. Each bar represents mean ± SEM (n = 4–7 per group, per time point). Shaded areas represent periods of darkness under LD, and projected periods corresponding to darkness under LL. Temporal profiles are presented corresponding to time of day (h) and projected time of day (h) for activity data in LD- and LL-treated rats, respectively. C, Representative χ2 periodograms of activity recordings in LD-Chow, LD-HFD, LL-Chow, or LL-HFD rats. Broken horizontal lines represents statistical significant threshold in determination of dominant circadian period. Note absence of circadian period in LL-Chow and LL-HFD groups. A mean measure of circadian rhythm strength denoted by FFT values (D), mean χ2 periodogram derived circadian period (E), and average daily (24 hours) activity of respective groups (F). Bar graphs represent mean ± SEM (n = 4–7 per group). *, P < .05 vs LD-Chow and LD-HFD.
Figure 3.
Figure 3.
Real-time bioluminescence monitoring of islets isolated from Per1-LUC transgenic rats exposed to LD or LL fed either regular chow or HFD. A, Representative examples of 5 days of continuous recordings of Per-driven bioluminescence rhythms in islets isolated from Per1-LUC transgenic rats exposed for 10 weeks to LD-Chow, LD-HFD, LL-Chow, or LL-HFD. Mean amplitude (B), phase (C), and period of circadian clock oscillations (D) in islets isolated from Per1-LUC transgenic rats exposed for 10 weeks to LD-Chow, LD-HFD, LL-Chow, or LL-HFD conditions. Bar graphs represent mean ± SEM (n = 4–6 per group). Temporal profiles are presented corresponding to “time of day (h)” and “projected time of day (h)” in LD- and LL-treated rats, respectively. *, P < .05 vs LD-Chow and LD-HFD.
Figure 4.
Figure 4.
Regulation of diurnal glucose homeostasis in rats exposed to LD or LL fed either regular chow or HFD. A, Diurnal profiles in plasma glucose (A), insulin (B), and calculated index of β-cell function HOMAβ (C) in rats fed either chow or HFD and exposed to 10 weeks of either standard LD (left) or LL (middle) light conditions. Bar graphs (right) display mean ± SEM of AUC for measures of plasma glucose (A), insulin (B), and HOMAβ (C) across the 24-hour day in rats exposed for 10 weeks to LD-Chow, LD-HFD, LL-Chow, or LL-HFD. Plasma samples were obtained at 6-hour intervals and P values in each graph represent statistical effects of “time” and “diet” interaction for each variable under LD and LL conditions derived from repeated measures two-way ANOVA analysis (GraphPad Prism v.6.0). *, P < .05 vs LD-Chow, LL-Chow, and LD-HFD; †, P < .05 vs LD-Chow; ‡, P < .05 vs LD-Chow and LL-HFD.
Figure 5.
Figure 5.
Measurements of glucose-stimulated insulin secretion in vitro by islet perifusion in isolated islets from rats exposed to LD or LL with concomitant exposure to HFD. A, Mean insulin concentration profiles during islet perifusion at low basal glucose 4mM (0–40 min) and hyperglycemic 16mM glucose (40–80 min) in isolated islets obtained from rats exposed to 10 weeks of either LD-HFD (black circles, n = 5) or LL-HFD (gray triangles, n = 5). B, Example of a representative pulsatile insulin secretion profile sampled at 1min intervals at 4mM (0–40 min) and 16mM glucose (40–80 min) in isolated islets from rats exposed to 10 weeks of either LD-HFD (black lines) or LL-HFD (gray lines). C, Mean rates of insulin secretion calculated as AUC from insulin concentrations obtained during islet perifusion at 4mM (0–40 min) and 16mM glucose (40–80 min) in isolated islets from rats exposed to 10 weeks of either LD-HFD (black bars, n = 5) or LL-HFD (gray bars, n = 5). *, P < .05 vs LD-HFD 4mM glucose, LL-HFD 4mM glucose and LL-HFD 16mM glucose.
Figure 6.
Figure 6.
Islet morphology in rats exposed to LD or LL fed either regular chow or HFD. A, Representative examples of pancreatic sections imaged at ×4 stained for insulin (brown) and hematoxylin (blue) in rats after 10 weeks of LD-Chow, LD-HFD, LL-Chow, or LL-HFD. B–D, Representative examples of islets stained by immunofluorescence for insulin (green) and counterstained with either glucagon (B), replication marker Ki-67 (C), or apoptosis marker TUNEL (D) and nuclear stain Dapi (blue) imaged at ×20 in rats after 10 weeks of LD-Chow, LD-HFD, LL-Chow, or LL-HFD conditions. White arrowheads and corresponding high magnification insets highlight examples of Ki-67 and TUNEL-positive β-cells.
Figure 7.
Figure 7.
Quantification of β-cell turnover in rats exposed to LD or LL fed either regular chow or HFD. Mean pancreatic mass (upper left), β-cell mass (upper right), frequency of β-cell proliferation (lower left), and frequency of β-cell apoptosis (lower right) in rats exposed to 10 weeks of LD-Chow, LD-HFD, LL-Chow, or LL-HFD. Bar graphs represent mean ± SEM (n = 5–6 per group). *, P < .05 vs LD-Chow; †, P < .05 vs LD-Chow and LL-Chow; ‡, P < .05 vs LD-Chow, LL-Chow, and LD-HFD.

References

    1. Seltzer HS, Allen EW, Herron AL, Jr, Brennan MT. Insulin secretion in response to glycemic stimulus: relation of delayed initial release to carbohydrate intolerance in mild diabetes mellitus. J Clin Invest. 1967;46:323–335. - PMC - PubMed
    1. Butler AE, Janson J, Bonner-Weir S, Ritzel R, Rizza RA, Butler PC. β-Cell deficit and increased β-cell apoptosis in humans with type 2 diabetes. Diabetes. 2003;52:102–110. - PubMed
    1. Brunzell JD, Robertson RP, Lerner RL, et al. Relationships between fasting plasma glucose levels and insulin secretion during intravenous glucose tolerance tests. J Clin Endocrinol Metab. 1976;42:222–229. - PubMed
    1. Boden G, Chen X, Polansky M. Disruption of circadian insulin secretion is associated with reduced glucose uptake in first-degree relatives of patients with type 2 diabetes. Diabetes. 1999;48:2182–2188. - PubMed
    1. Lee A, Ader M, Bray GA, Bergman RN. Diurnal variation in glucose tolerance. Cyclic suppression of insulin action and insulin secretion in normal-weight, but not obese, subjects. Diabetes. 1992;41:750–759. - PubMed

Publication types

MeSH terms