. 2016 Jan 1;124(Pt A):204-213.
doi: 10.1016/j.neuroimage.2015.08.071. Epub 2015 Sep 5.

Imaging fast electrical activity in the brain with electrical impedance tomography

Affiliations

Imaging fast electrical activity in the brain with electrical impedance tomography

Kirill Y Aristovich et al. Neuroimage. .

Abstract

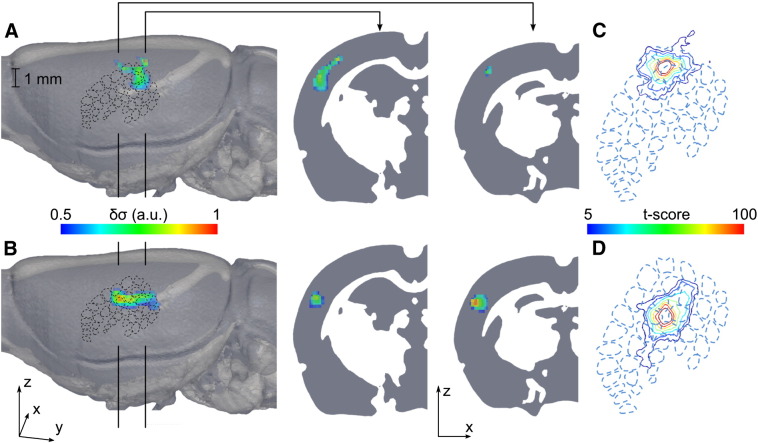
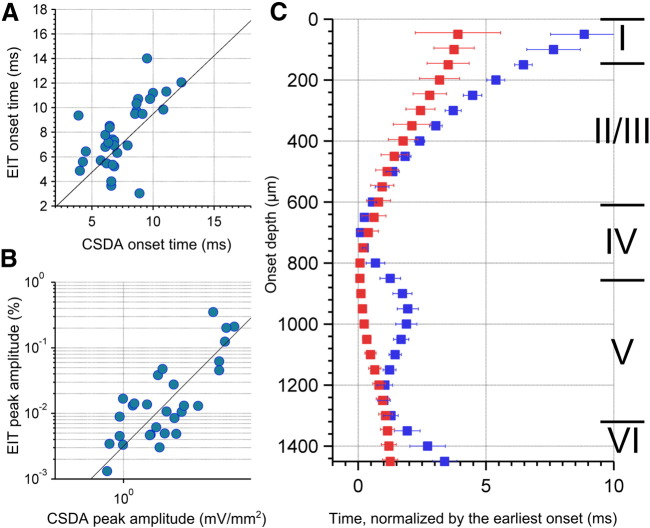
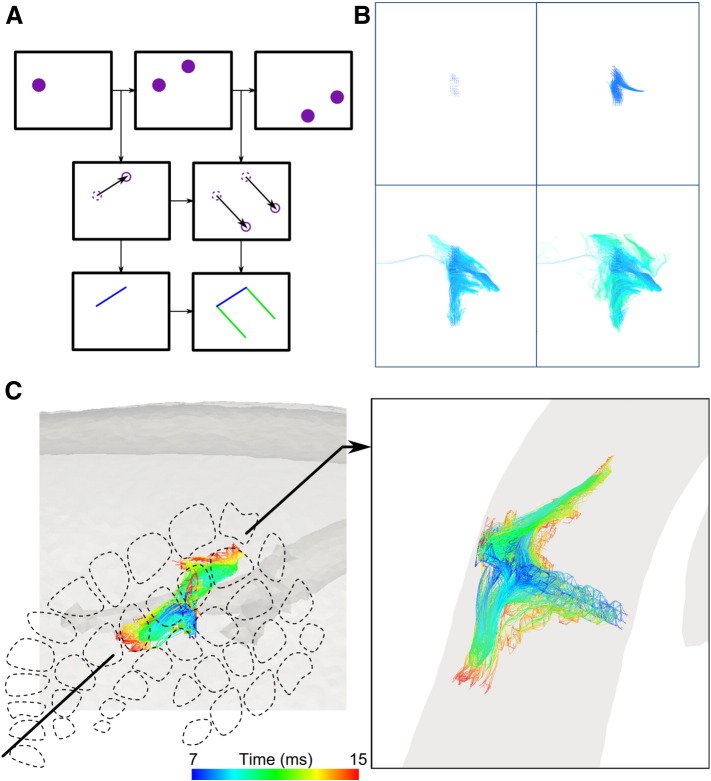
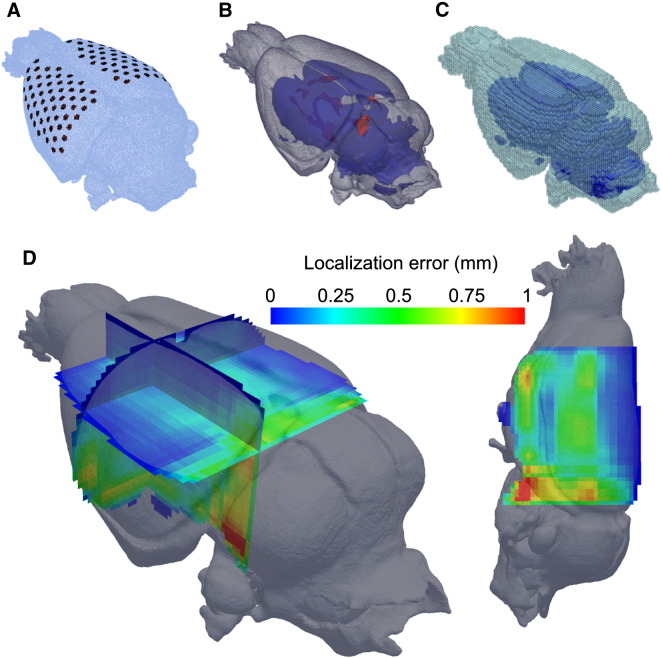
Imaging of neuronal depolarization in the brain is a major goal in neuroscience, but no technique currently exists that could image neural activity over milliseconds throughout the whole brain. Electrical impedance tomography (EIT) is an emerging medical imaging technique which can produce tomographic images of impedance changes with non-invasive surface electrodes. We report EIT imaging of impedance changes in rat somatosensory cerebral cortex with a resolution of 2ms and <200μm during evoked potentials using epicortical arrays with 30 electrodes. Images were validated with local field potential recordings and current source-sink density analysis. Our results demonstrate that EIT can image neural activity in a volume 7×5×2mm in somatosensory cerebral cortex with reduced invasiveness, greater resolution and imaging volume than other methods. Modeling indicates similar resolutions are feasible throughout the entire brain so this technique, uniquely, has the potential to image functional connectivity of cortical and subcortical structures.


Figures

Supplementary Fig. 1
Variable current amplitude control. The mean (± 1 SE) over all repeats (n = 24) in 2 rats. There was no significant difference between the percentage impedance changes across current amplitudes (p > 0.3 using one-way ANOVA).
Supplementary Fig. 2
Summary of EIT and SCDA raw data of 16 recordings. Each subplot represents single recording with stimulation signal (black), average raw EIT signal before image reconstruction in single channel (red), and CSDA data over depth for 32 interpolation points (pale colors). The signals are normalized between recordings to allow visual comparison.
Fig. 1
Fig. 1
Method and paradigm. A) The 30 electrode array was placed over the exposed left S1 cerebral cortex. A 16 contact local field potential (LFP; orange dot) probe was placed through the center of the array over the activated whisker barrel group determined by intrinsic optical imaging. B) Impedance acquisition. The whiskers contralateral to the electrode array were moved forward and backward every second (stimulation waveform — Stim) and 15 cycles averaged for each impedance measurement. A constant amplitude current of 50 μA at 1725 Hz was injected through selected pairs of electrodes. The resulting voltages were recorded on all other 28 electrodes with respect to a reference in the contralateral scalp, low pass filtered at 400 Hz to yield evoked potentials (EP), and band pass filtered at 1725 ± 500 Hz to yield an amplitude modulated sine wave (V), which was demodulated to reveal the impedance change (|dZ|). C) This sequence was repeated for all 30 electrode injection pairs. The 1st and 30th injection pairs are illustrated. Red — injection pair; blue — resulting impedance decreases. Images were reconstructed using a 5 M element FEM tetrahedral mesh segmented into layers orthogonal to somatosensory cortex (D), and the resulting data stored in 4D spatiotemporal format (E).
Fig. 2
Fig. 2
Example of EIT image during forward deflection of whisker group 1 (δ, γ, E1, and D1). The sequence of images (conductivity change — δσ), 2 ms apart, shows the onset of activity at 7 ms occurring at c. 800 μm beneath the pial surface, and over the ensuing milliseconds encompasses a larger volume reaching a maximum at 10–11 ms, following which the activity spreads to adjacent areas in S1 and disappears at 17 ms.
Fig. 3
Fig. 3
Population statistics of EIT images. A) and B) Grand average normalized conductivity change (δσ) at 8 ms for stimulation of whisker group 1 (δ, γ, E1, and D1), and group 2 (D2, C2, D3 and C3) respectively (n = 16 in 4 rats). C) and D) Significance map of peak δσ across rats and trials, projected onto the pial surface, across all layers (n = 16 in 4 rats) for group 1 and group 2 respectively.
Fig. 4
Fig. 4
Cross-validation of EIT with CSDA. A) Correlation plot between EIT and CSDA onset time (n = 32, N = 4, r = 0.6, p < 0.001), B) correlation plot between EIT and CSDA amplitude (n = 32, N = 4, r = 0.95, p < 0.001), and C) the translaminar onset latencies for EIT (red) and CSDA (blue) over the depth, normalized by the time of earliest activity, mean (squares), and standard error (error bar).
Fig. 5
Fig. 5
Example of spatiotemporal trajectories during forward deflection of whisker group 2 (D2, C2, D3 and C3). A) The trajectories have been computed with time sequenced images, using a particle filter approach, resulting in a B) set of 3D curves of activity propagation, color-coded with timing of activation over milliseconds. C) The surface (left) and coronal (right) views reveal that activity starts in layer IV, propagates into supra- and infragranular layers within the stimulated barrels, and then spreads to adjacent whisker barrel rows predominantly through layers II/III.
Fig. 6
Fig. 6
Accuracy of image reconstruction with a 120 contact electrode array, as determined in simulations. A) 15 M-elements forward mesh, B) comprising anatomically accurate material properties: gray matter (transparent gray), white matter (blue), and CSF (red), and C) a 100 k hexahedral elements inverse mesh, were used to access the accuracy. D) Localization error was calculated throughout the volume at 1000 locations in simulation. A superior-lateral (left) and left sagittal (right) view is shown of the mesh with rasterization planes through the mesh color-coded according to the localization error determined by difference between real and reconstructed perturbation location (1% conductivity change, 0.5 mm diameter). The transverse plane in the left subplot is positioned 3 mm below vertex of the brain. The resolution in most of the neocortex is < 250 μm, and is < 500 μm throughout most of the brain (with the exclusion of structures adjacent to the skull-base and ventricles).

References

    1. Adler A., Lionheart W.R.B. Uses and abuses of EIDORS: an extensible software base for EIT. Physiol. Meas. 2006;27:S25–S42. - PubMed
    1. Adler A., Arnold J.H., Bayford R., Borsic A., Brown B., Dixon P., Faes T.J.C., Frerichs I., Gagnon H., Gärber Y., Grychtol B., Hahn G., Lionheart W.R.B., Malik A., Patterson R.P., Stocks J., Tizzard A., Weiler N., Wolf G.K. GREIT: a unified approach to 2D linear EIT reconstruction of lung images. Physiol. Meas. 2009;30:S35–S55. - PubMed
    1. Ahrens M.B., Orger M.B., Robson D.N., Li J.M., Keller P.J. Whole-brain functional imaging at cellular resolution using light-sheet microscopy. Nat. Methods. 2013;10:413–420. - PubMed
    1. Aristovich K.Y., Santos G.S. Dos, Packham B.C., Holder D.S. A method for reconstructing tomographic images of evoked neural activity with electrical impedance tomography using intracranial planar arrays. Physiol. Meas. 2014;35:1095–1109. - PubMed
    1. Armstrong-James M., Callahan C.A., Friedman M.A. Thalamo-cortical processing of vibrissal information in the rat. I. Intracortical origins of surround but not centre-receptive fields of layer IV neurones in the rat S1 barrel. J. Comp. Neurol. 1991;303:193–210. - PubMed

Publication types

LinkOut - more resources