. 2015 Sep 8:6:8170.
doi: 10.1038/ncomms9170.

Defining the relationship between infection prevalence and clinical incidence of Plasmodium falciparum malaria

Affiliations

Defining the relationship between infection prevalence and clinical incidence of Plasmodium falciparum malaria

Ewan Cameron et al. Nat Commun. .

Abstract

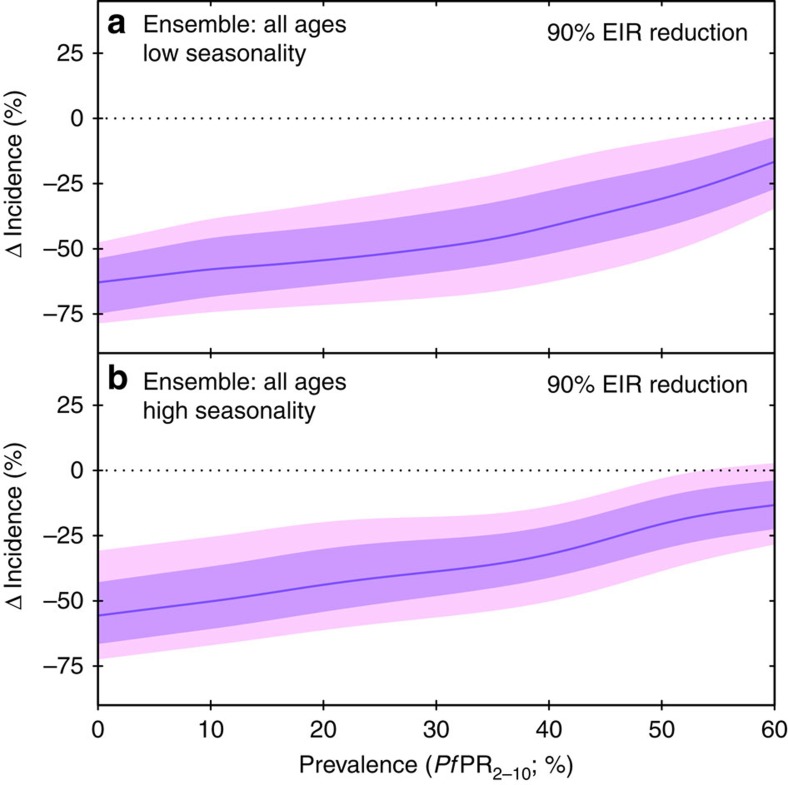
In many countries health system data remain too weak to accurately enumerate Plasmodium falciparum malaria cases. In response, cartographic approaches have been developed that link maps of infection prevalence with mathematical relationships to predict the incidence rate of clinical malaria. Microsimulation (or 'agent-based') models represent a powerful new paradigm for defining such relationships; however, differences in model structure and calibration data mean that no consensus yet exists on the optimal form for use in disease-burden estimation. Here we develop a Bayesian statistical procedure combining functional regression-based model emulation with Markov Chain Monte Carlo sampling to calibrate three selected microsimulation models against a purpose-built data set of age-structured prevalence and incidence counts. This allows the generation of ensemble forecasts of the prevalence-incidence relationship stratified by age, transmission seasonality, treatment level and exposure history, from which we predict accelerating returns on investments in large-scale intervention campaigns as transmission and prevalence are progressively reduced.


Figures

Figure 1
Figure 1. Calibrated posterior predictions of the P. falciparum prevalence–incidence relationship under conditions of low historical treatment and low transmission seasonality from the three microsimulation models comprising our ensemble, stratified by age.
(a,d,g) OpenMalaria; (b,e,h) EMOD DTK; (c,f,i) Griffin IS. In each panel the coloured curve and shaded zones illustrate the (pointwise) median and surrounding 68 and 95% credible intervals for incidence detectable with daily ACD supposing no change to treatment, while the dashed black lines illustrate the median prediction corresponding to a study year intervention increasing the effective treatment rate from 35 to 85% (that is, the ‘observer effect' of ethical study designs).
Figure 2
Figure 2. Ensemble model predictions of the P. falciparum prevalence–incidence relationship, stratified by age.
Predictions are given under conditions of low historical treatment and low transmission seasonality (a,d,g), high seasonality (b,e,h) and low seasonality after a 90% decline in EIR over the past 5 years (c,f,i). In each panel the coloured curve and shaded zones illustrate the (pointwise) median and surrounding 68 and 95% credible intervals for incidence detectable with daily ACD. These ensemble predictions represent a weighted average of the calibrated posteriors from each transmission model with weights assigned by the median of subset posteriors algorithm.
Figure 3
Figure 3. Ensemble model predictions of changes to clinical incidence resulting from a 90% reduction in EIR over the past 5 years, as a function of starting prevalence.
In each panel the coloured curve and shaded zones illustrate the (pointwise) median and surrounding 68 and 95% credible intervals for the change in incidence detectable with daily ACD. Predictions are given for low (a) and high (b) seasonality settings.

Similar articles

Cited by

References

    1. World Health Organisation. World Malaria Report 1-227 WHO, Switzerland (2014).
    1. Hay S. I. et al.. A world malaria map: Plasmodium falciparum endemicity in 2007. PLoS Med. 6, e1000048 (2009). - PMC - PubMed
    1. Gething P. W. et al.. A new world malaria map: Plasmodium falciparum endemicity in 2010. Malar. J. 10, 378 (2011). - PMC - PubMed
    1. Craig M. H., Snow R. W. & le Sueur D. A climate-based distribution model of malaria transmission in sub-Saharan Africa. Parasitol. Today 15, 105–111 (1999). - PubMed
    1. Hay S. I. et al.. Estimating the global clinical burden of Plasmodium falciparum malaria in 2007. PLoS Med. 7, e1000290 (2010). - PMC - PubMed

Publication types