. 2015 Sep 8;10(9):e0137357.
doi: 10.1371/journal.pone.0137357. eCollection 2015.

Analyzing and Modeling the Kinetics of Amyloid Beta Pores Associated with Alzheimer's Disease Pathology

Affiliations

Analyzing and Modeling the Kinetics of Amyloid Beta Pores Associated with Alzheimer's Disease Pathology

Ghanim Ullah et al. PLoS One. .

Abstract

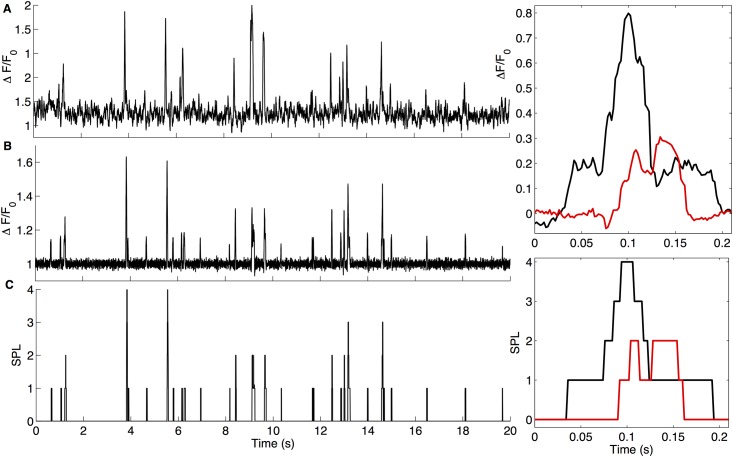
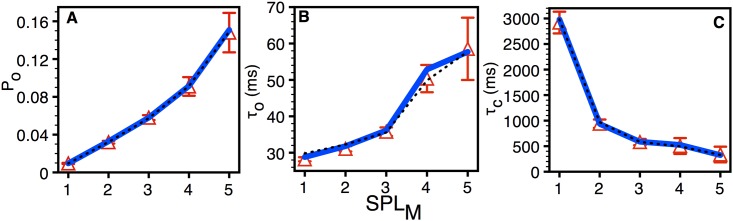
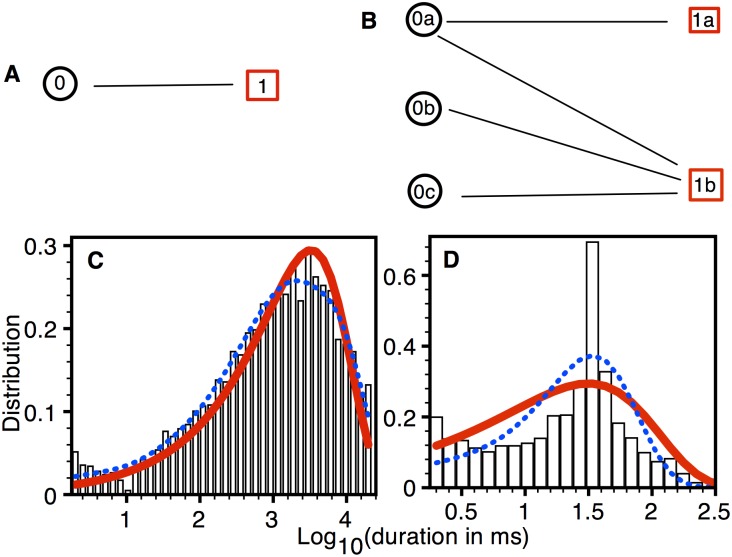
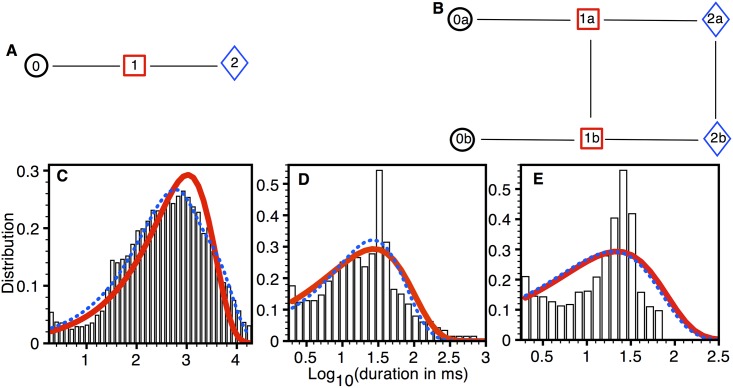
Amyloid beta (Aβ) oligomers associated with Alzheimer's disease (AD) form Ca2+-permeable plasma membrane pores, leading to a disruption of the otherwise well-controlled intracellular calcium (Ca2+) homeostasis. The resultant up-regulation of intracellular Ca2+ concentration has detrimental implications for memory formation and cell survival. The gating kinetics and Ca2+ permeability of Aβ pores are not well understood. We have used computational modeling in conjunction with the ability of optical patch-clamping for massively parallel imaging of Ca2+ flux through thousands of pores in the cell membrane of Xenopus oocytes to elucidate the kinetic properties of Aβ pores. The fluorescence time-series data from individual pores were idealized and used to develop data-driven Markov chain models for the kinetics of the Aβ pore at different stages of its evolution. Our study provides the first demonstration of developing Markov chain models for ion channel gating that are driven by optical-patch clamp data with the advantage of experiments being performed under close to physiological conditions. Towards the end, we demonstrate the up-regulation of gating of various Ca2+ release channels due to Aβ pores and show that the extent and spatial range of such up-regulation increases as Aβ pores with low open probability and Ca2+ permeability transition into those with high open probability and Ca2+ permeability.


Conflict of interest statement

Competing Interests: The authors have declared that no competing interests exist.

Figures

Fig 1
Fig 1. Idealizing the fluorescence time-series data from a single Aβ pore.
Fluorescence profile from a region of interest (1μm2) centered on an Aβ42 pore, representing the Ca2+ flux through the pore without (A) and with background subtraction (B). (C) Idealized trace, where the vertical axis represents the SPL to which the pore opens at a given time and zero represents the closed state. The two insets show two events on extended time-scale (Ca2+ flux through the pore with background subtraction (top) and idealized traces (bottom)).
Fig 2
Fig 2. Average statistics of Aβ42 pores.
Mean open probability (A), open time (B), and closed time (C) as a function of SPLM (maximum permeability in units of SPLs) for all pores. The symbols represent the experimental data. The thick solid and thin dotted lines are the fits from the simplest and best models respectively presented below. The bars represent standard error of the mean.
Fig 3
Fig 3. Model fits to the distributions from type 1 pore.
(A) The simplest (BIC = -926) and (B) best (BIC = -1071) models. Closed (C) and open (D) dwell-time distributions (probability density functions (PDF)): bars (experimental data), thick solid line (simplest model), and thin dotted line (best model). Experimental data taken from 217 type 1 pores in three oocytes.
Fig 4
Fig 4. Model fits to type 2 pores.
(A) The simplest (BIC = -16495) and (B) best (BIC = -17039) models. Dwell-time distribution (PDF) in closed state (C), SPL 1 (D), and SPL 2 (E): bars (experimental data), thick solid line (simplest model), and thin dotted line (best model). Experimental data taken from 232 type 2 pores in three oocytes.
Fig 5
Fig 5. Model fits to type 3 Aβ pores.
(A) The simplest (BIC = -21844) and (B) best (BIC = -22887) models. Dwell-time distribution (PDF) in closed level (C), SPL 1 (D), SPL 2 (E), and SPL 3 (F): bars (experimental data), thick solid line (simplest model), and thin dotted line (best model). Experimental data taken from 146 type 3 pores in three oocytes.
Fig 6
Fig 6. Model fits to type 4 Aβ pores.
(A) The simplest (BIC = -8619) and (B) best (BIC = -9449) model. Dwell-time distribution (PDF) in closed level (C), SPL 1 (D), SPL 2 (E), SPL 3 (F), and SPL 4 (G): bars (experimental data), thick solid line (simplest model), and thin dotted line (best model). Experimental data taken from 35 type 4 pores in three oocytes.
Fig 7
Fig 7. Model fits to type 5 Aβ pores.
(A) The simplest (BIC = -4738) and (B) best (BIC = -5229) models. Dwell-time distribution (PDF) in closed level (C), SPL 1 (D), SPL 2 (E), SPL 3 (F), SPL 4 (G), and SPL 5 (H): bars (experimental data), thick solid line (simplest model), and thin dotted line (best model). Experimental data taken from 13 type 5 pores in three oocytes.
Fig 8
Fig 8. The normalized mean occupancies of all conductance levels in all five groups of Aβ42 pores.
The squares, circles, diamonds, up, and down triangles represent the experimental data and dotted lines are the fits from the best models. Black, red, blue, green, and pink represent pores with SPLM 1, 2, 3, 4, and 5 respectively.
Fig 9
Fig 9. Peak intracellular Ca2+ concentration at the pore location during a single opening of type 1 (black), 2 (blue), 3 (red), 4 (purple), and 5 (green) Aβ1–42 pore during the simulation in S3 Fig.
Here we show Ca2+ concentration along X-axis at the center of Y-axis passing through the pore.
Fig 10
Fig 10. A measure of Aβ pore toxicity in terms of effect on the gating of other channels in the neighborhood.
The open probability of IP3R at [IP3] = 100nM (A), normalized current through Ca2+-activated Cl- channel at membrane potential, V = -40mV (B), and open probability of BK channel at V = -60mV (C) and 40mV (D) respectively as a function of distance from the center of an active Aβ pore of type 1 (black), 2 (blue), 3 (red), 4 (purple), and 5 (green).

Similar articles

Cited by

References

    1. Hardy J. A. and Higgins G. A. (1992) Alzheimer’s disease: the amyloid cascade hypothesis. Science, 256:184–185. - PubMed
    1. Haass C., Schlossmacher M. G., Hung A. Y., Vigo-Pelfrey C., Mellon A., Ostaszewski B. L., et al. (1992) Amyloid beta-peptide is produced by cultured cells during normal metabolism. Nature, 359:322–325. - PubMed
    1. Small D. H., Klaver D. W., and Foa L. (2010) Presenilins and the gamma-secretase: still a complex problem. Mol Brain, 3:7 10.1186/1756-6606-3-7 - DOI - PMC - PubMed
    1. Cras P., Kawai M., Lowery D., Gonzalez-DeWhitt P., Greenberg B., and Perry G. (1991) Senile plaque neurites in Alzheimer disease accumulate amyloid precursor protein. Proc. Natl. Acad. Sci. USA., 88:7552–7556. - PMC - PubMed
    1. Demuro A., Mina E., Kayed R., Milton S. C., Parker I., and Glabe C. G. (2005) Calcium dysregulation and membrane disruption as a ubiquitous neurotoxic mechanism of soluble amyloid oligomers. J Biol Chem., 280:17294–17300. - PubMed

Publication types

MeSH terms