

Trends in Care Practices, Morbidity, and Mortality of Extremely Preterm Neonates, 1993-2012
- PMID: 26348753
- PMCID: PMC4787615
- DOI: 10.1001/jama.2015.10244
Trends in Care Practices, Morbidity, and Mortality of Extremely Preterm Neonates, 1993-2012
Abstract
Importance: Extremely preterm infants contribute disproportionately to neonatal morbidity and mortality.
Objective: To review 20-year trends in maternal/neonatal care, complications, and mortality among extremely preterm infants born at Neonatal Research Network centers.
Design, setting, participants: Prospective registry of 34,636 infants, 22 to 28 weeks' gestation, birth weight of 401 to 1500 g, and born at 26 network centers between 1993 and 2012.
Exposures: Extremely preterm birth.
Main outcomes and measures: Maternal/neonatal care, morbidities, and survival. Major morbidities, reported for infants who survived more than 12 hours, were severe necrotizing enterocolitis, infection, bronchopulmonary dysplasia, severe intracranial hemorrhage, cystic periventricular leukomalacia, and/or severe retinopathy of prematurity. Regression models assessed yearly changes and were adjusted for study center, race/ethnicity, gestational age, birth weight for gestational age, and sex.
Results: Use of antenatal corticosteroids increased from 1993 to 2012 (24% [348 of 1431 infants]) to 87% (1674 of 1919 infants]; P < .001), as did cesarean delivery (44% [625 of 1431 births] to 64% [1227 of 1921]; P < .001). Delivery room intubation decreased from 80% (1144 of 1433 infants) in 1993 to 65% (1253 of 1922) in 2012 (P < .001). After increasing in the 1990s, postnatal steroid use declined to 8% (141 of 1757 infants) in 2004 (P < .001), with no significant change thereafter. Although most infants were ventilated, continuous positive airway pressure without ventilation increased from 7% (120 of 1666 infants) in 2002 to 11% (190 of 1756 infants) in 2012 (P < .001). Despite no improvement from 1993 to 2004, rates of late-onset sepsis declined between 2005 and 2012 for infants of each gestational age (median, 26 weeks [37% {109 of 296} to 27% {85 of 320}]; adjusted relative risk [RR], 0.93 [95% CI, 0.92-0.94]). Rates of other morbidities declined, but bronchopulmonary dysplasia increased between 2009 and 2012 for infants at 26 to 27 weeks' gestation (26 weeks, 50% [130 of 258] to 55% [164 of 297]; P < .001). Survival increased between 2009 and 2012 for infants at 23 weeks' gestation (27% [41 of 152] to 33% [50 of 150]; adjusted RR, 1.09 [95% CI, 1.05-1.14]) and 24 weeks (63% [156 of 248] to 65% [174 of 269]; adjusted RR, 1.05 [95% CI, 1.03-1.07]), with smaller relative increases for infants at 25 and 27 weeks' gestation, and no change for infants at 22, 26, and 28 weeks' gestation. Survival without major morbidity increased approximately 2% per year for infants at 25 to 28 weeks' gestation, with no change for infants at 22 to 24 weeks' gestation.
Conclusions and relevance: Among extremely preterm infants born at US academic centers over the last 20 years, changes in maternal and infant care practices and modest reductions in several morbidities were observed, although bronchopulmonary dysplasia increased. Survival increased most markedly for infants born at 23 and 24 weeks' gestation and survival without major morbidity increased for infants aged 25 to 28 weeks. These findings may be valuable in counseling families and developing novel interventions.
Trial registration: clinicaltrials.gov Identifier: NCT00063063.
Conflict of interest statement
None of the authors have any conflicts of interest to disclose.
Figures
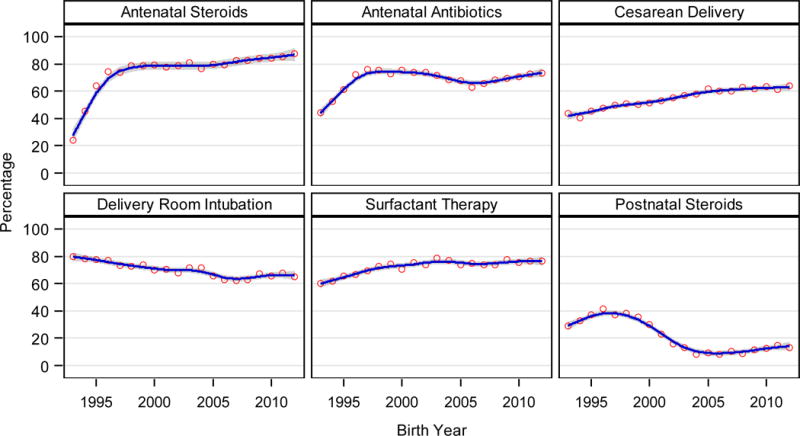
| Adjusted RR (95% CI) for the change per year in all infants where year-GA interaction non-significant | ||
| Antenatal Steroids | Antenatal Antibiotics | Cesarean Delivery |
| 1993–1997: 1.14 (1.12–1.15) | ||
| (see eFigure 1) | 1998–2006: 0.978 (0.976–0.981) | (see eFigure 2) |
| 2007–2012: 1.019 (1.014–1.023) | ||
| Delivery Room Intubation | Surfactant Therapy | Postnatal Steroids |
| 1993–1996: 1.18 (1.14–1.21) | ||
| (see eFigure 3) | (see eFigure 4) | 1997–2004: 0.82 (0.81–0.83) |
| 2005–2012: 1.00 (0.99–1.02) | ||
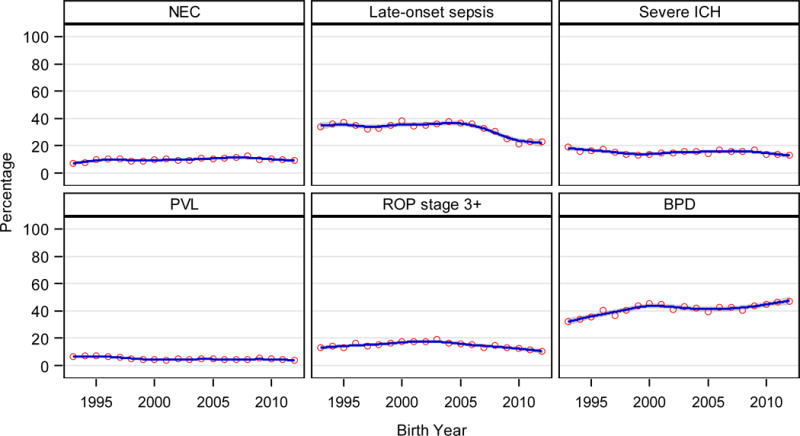
| Adjusted RR (95% CI) for the change per year in all infants where year-GA interaction non-significant | ||
| NEC | Late-onset sepsis | Severe ICH |
| 1993–2008: 1.02 (1.01–1.03) | (see eFigure 5) | (see eFigure 6) |
| 2009–2012: 0.94 (0.91–0.98) | ||
| PVL | ROP stage 3+ | BPD |
| (see eFigure 7) | 1993–2003: 1.02 (1.01–1.03) | (see eFigure 8) |
| 2004–2012: 0.94 (0.93–0.95) | ||
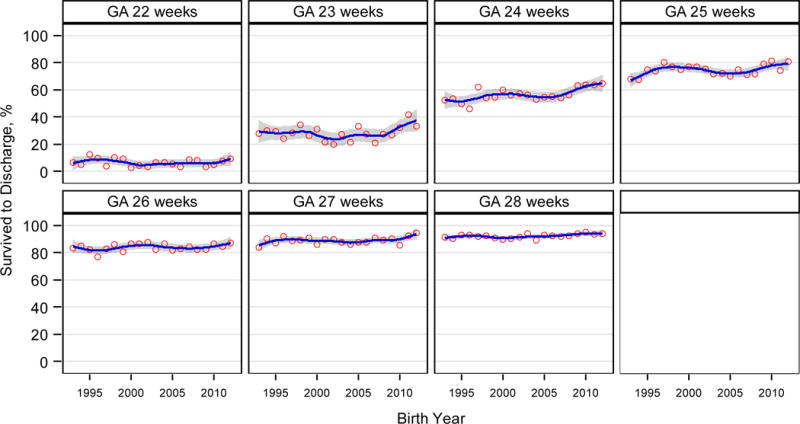
| Adjusted RR (95% CI) for the change per year 2009–2012 | |||
| 22 weeks | 23 weeks | 24 weeks | 25 weeks |
| 1.06 (0.89–1.25) | 1.09 (1.05–1.14) | 1.05 (1.03–1.07) | 1.02 (1.01–1.03) |
| 26 weeks | 27 weeks | 28 weeks | |
| 1.00 (0.996–1.015) | 1.01 (1.002–1.016) | 1.00 (0.998–1.011) | |
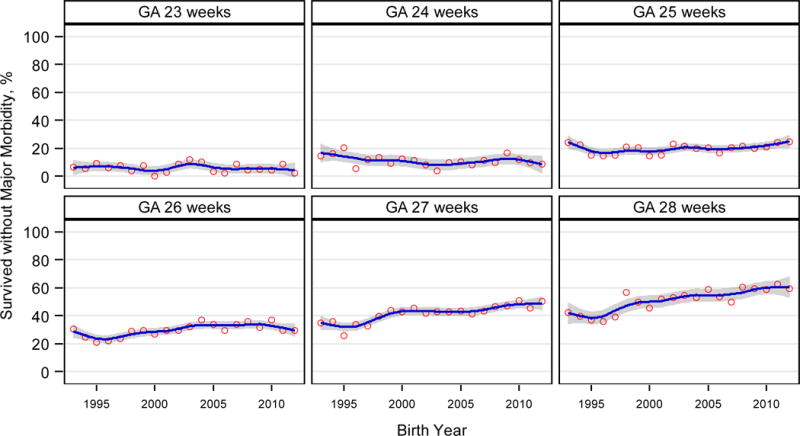
| Adjusted RR (95% CI) for the change per year | ||
| 23 weeks | 24 weeks | 25 weeks |
| 1.00 (0.95–1.05) | 0.99 (0.97–1.01) | 1.02 (1.01–1.03) |
| 26 weeks | 27 weeks | 28 weeks |
| 1.02 (1.01–1.03) | 1.02 (1.02–1.03) | 1.03 (1.02–1.03) |
Comment in
-
Progress in the Care of Extremely Preterm Infants.JAMA. 2015 Sep 8;314(10):1007-8. doi: 10.1001/jama.2015.10911. JAMA. 2015. PMID: 26348750 No abstract available.
-
Outcomes in extremely preterm US infants improve, study finds.BMJ. 2015 Sep 9;351:h4851. doi: 10.1136/bmj.h4851. BMJ. 2015. PMID: 26353773 No abstract available.
References
-
- Fanaroff AA, Stoll BJ, Wright LL, et al. Trends in neonatal morbidity and mortality for very low birthweight infants. Am J Obstet Gynecol. 2007;196:147.e1–8. - PubMed
-
- Horbar JD, Carpenter JH, Badger GJ, et al. Mortality and neonatal morbidity among infants 501 to 1500 grams from 2000 to 2009. Pediatrics. 2012;129:1019–1026. - PubMed
-
- Shah PS, Sankaran K, Aziz K, et al. the Canadian Neonatal Network Outcomes of preterm infants <29 weeks gestation over 10-year period in Canada: a cause for concern? J Perinatol. 2012;32:132–138. - PubMed
-
- Berger TM, Steurer MA, Woerner A, et al. for the Swiss Neonatal Network Trends and centre-to-centre variability in survival rates of very preterm infants (<32 weeks) over a 10-year period in Switzerland. Arch Dis Child Fetal Neonatal Ed. 2012;97:F323–F328. - PubMed
Publication types
MeSH terms
Substances
Associated data
Grants and funding
- U10 HD27851/HD/NICHD NIH HHS/United States
- UL1 TR442/TR/NCATS NIH HHS/United States
- U10 HD68284/HD/NICHD NIH HHS/United States
- U10 HD027856/HD/NICHD NIH HHS/United States
- U10 HD40689/HD/NICHD NIH HHS/United States
- U10 HD021373/HD/NICHD NIH HHS/United States
- UL1 TR001111/TR/NCATS NIH HHS/United States
- U10 HD021385/HD/NICHD NIH HHS/United States
- M01 RR44/RR/NCRR NIH HHS/United States
- UL1 TR142/TR/NCATS NIH HHS/United States
- UL1 TR77/TR/NCATS NIH HHS/United States
- UL1 TR93/TR/NCATS NIH HHS/United States
- U10 HD40492/HD/NICHD NIH HHS/United States
- U10 HD53119/HD/NICHD NIH HHS/United States
- M01 RR59/RR/NCRR NIH HHS/United States
- U10 HD68278/HD/NICHD NIH HHS/United States
- U10 HD053124/HD/NICHD NIH HHS/United States
- U10 HD053119/HD/NICHD NIH HHS/United States
- M01 RR6022/RR/NCRR NIH HHS/United States
- U10 HD53124/HD/NICHD NIH HHS/United States
- U10 HD21364/HD/NICHD NIH HHS/United States
- U10 HD34216/HD/NICHD NIH HHS/United States
- U10 HD021364/HD/NICHD NIH HHS/United States
- UL1 TR6/TR/NCATS NIH HHS/United States
- UL1 TR41/TR/NCATS NIH HHS/United States
- U10 HD027880/HD/NICHD NIH HHS/United States
- M01 RR70/RR/NCRR NIH HHS/United States
- U10 HD36790/HD/NICHD NIH HHS/United States
- U10 HD040521/HD/NICHD NIH HHS/United States
- U10 HD053109/HD/NICHD NIH HHS/United States
- UG1 HD087229/HD/NICHD NIH HHS/United States
- U10 HD40521/HD/NICHD NIH HHS/United States
- U10 HD27880/HD/NICHD NIH HHS/United States
- M01 RR008084/RR/NCRR NIH HHS/United States
- UL1 TR001449/TR/NCATS NIH HHS/United States
- UG1 HD053089/HD/NICHD NIH HHS/United States
- U10 HD27904/HD/NICHD NIH HHS/United States
- UL1 TR1111/TR/NCATS NIH HHS/United States
- M01 RR633/RR/NCRR NIH HHS/United States
- U10 HD53109/HD/NICHD NIH HHS/United States
- UL1 TR1117/TR/NCATS NIH HHS/United States
- U10 HD040461/HD/NICHD NIH HHS/United States
- U10 HD40498/HD/NICHD NIH HHS/United States
- U10 HD53089/HD/NICHD NIH HHS/United States
- U10 HD27871/HD/NICHD NIH HHS/United States
- M01 RR016587/RR/NCRR NIH HHS/United States
- M01 RR7122/RR/NCRR NIH HHS/United States
- U10 HD040689/HD/NICHD NIH HHS/United States
- U10 HD040492/HD/NICHD NIH HHS/United States
- M01 RR64/RR/NCRR NIH HHS/United States
- U10 HD027853/HD/NICHD NIH HHS/United States
- U10 HD027904/HD/NICHD NIH HHS/United States
- U10 HD021397/HD/NICHD NIH HHS/United States
- U10 HD068244/HD/NICHD NIH HHS/United States
- U10 HD27856/HD/NICHD NIH HHS/United States
- U10 HD068263/HD/NICHD NIH HHS/United States
- U10 HD034167/HD/NICHD NIH HHS/United States
- U10 HD40461/HD/NICHD NIH HHS/United States
- UG1 HD034216/HD/NICHD NIH HHS/United States
- U10 HD27853/HD/NICHD NIH HHS/United States
- M01 RR39/RR/NCRR NIH HHS/United States
- M01 RR30/RR/NCRR NIH HHS/United States
- U10 HD027871/HD/NICHD NIH HHS/United States
- U10 HD68263/HD/NICHD NIH HHS/United States
- U10 HD068270/HD/NICHD NIH HHS/United States
- UL1 TR000041/TR/NCATS NIH HHS/United States
- M01 RR007122/RR/NCRR NIH HHS/United States
- U10 HD027851/HD/NICHD NIH HHS/United States
- UG1 HD068284/HD/NICHD NIH HHS/United States
- UG1 HD021385/HD/NICHD NIH HHS/United States
- UL1 TR001425/TR/NCATS NIH HHS/United States
- UG1 HD021364/HD/NICHD NIH HHS/United States
- UG1 HD027880/HD/NICHD NIH HHS/United States
- M01 RR80/RR/NCRR NIH HHS/United States
- M01 RR16587/RR/NCRR NIH HHS/United States
- U10 HD21397/HD/NICHD NIH HHS/United States
- UL1 TR001117/TR/NCATS NIH HHS/United States
- U10 HD068284/HD/NICHD NIH HHS/United States
- UG1 HD053109/HD/NICHD NIH HHS/United States
- M01 RR750/RR/NCRR NIH HHS/United States
- U10 HD068278/HD/NICHD NIH HHS/United States
- M01 RR8084/RR/NCRR NIH HHS/United States
- U10 HD21415/HD/NICHD NIH HHS/United States
- M01 RR54/RR/NCRR NIH HHS/United States
- U10 HD68270/HD/NICHD NIH HHS/United States
- U10 HD68244/HD/NICHD NIH HHS/United States
- M01 RR997/RR/NCRR NIH HHS/United States
- U10 HD21373/HD/NICHD NIH HHS/United States
- U10 HD21385/HD/NICHD NIH HHS/United States
- UL1 TR454/TR/NCATS NIH HHS/United States
- M01 RR32/RR/NCRR NIH HHS/United States
- U10 HD034216/HD/NICHD NIH HHS/United States
- U10 HD036790/HD/NICHD NIH HHS/United States
- U10 HD040498/HD/NICHD NIH HHS/United States
- U10 HD27881/HD/NICHD NIH HHS/United States
- M01 RR006022/RR/NCRR NIH HHS/United States
- UL1 TR105/TR/NCATS NIH HHS/United States
- U10 HD053089/HD/NICHD NIH HHS/United States
- UL1 TR42/TR/NCATS NIH HHS/United States
LinkOut - more resources
Full Text Sources
Other Literature Sources
Medical
