. 2015 Oct 1;125(10):3809-18.
doi: 10.1172/JCI77095. Epub 2015 Sep 8.

Tribbles-1 regulates hepatic lipogenesis through posttranscriptional regulation of C/EBPα

Tribbles-1 regulates hepatic lipogenesis through posttranscriptional regulation of C/EBPα

Robert C Bauer et al. J Clin Invest. .

Abstract

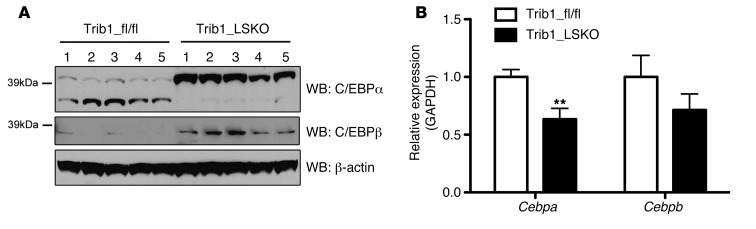
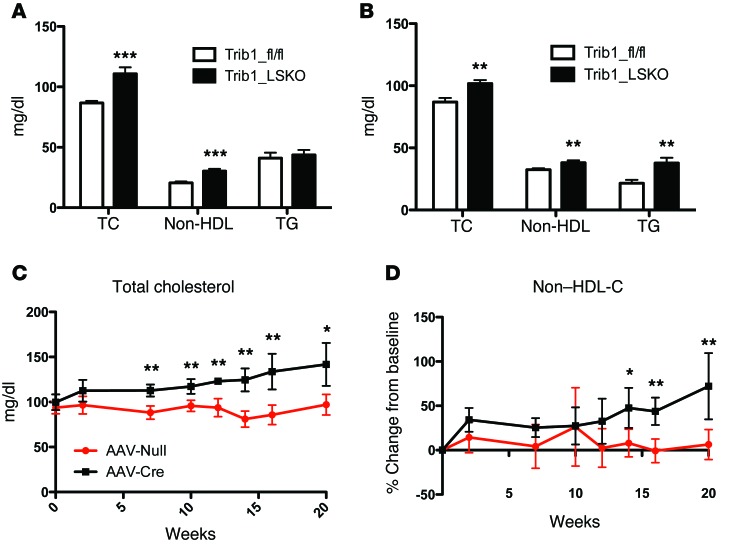
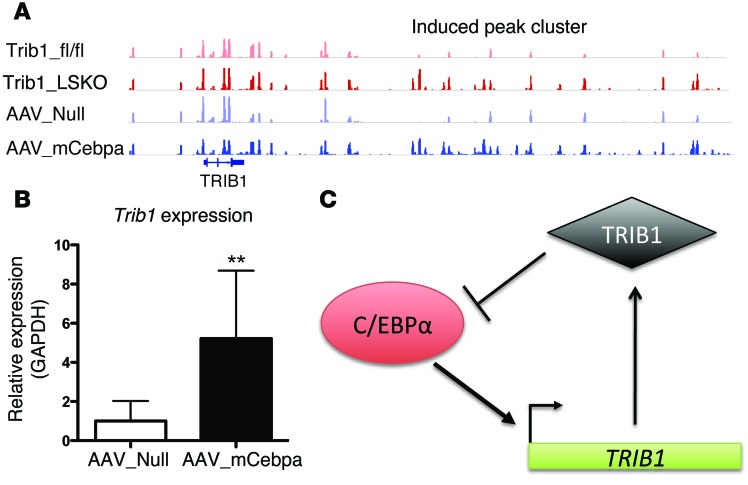
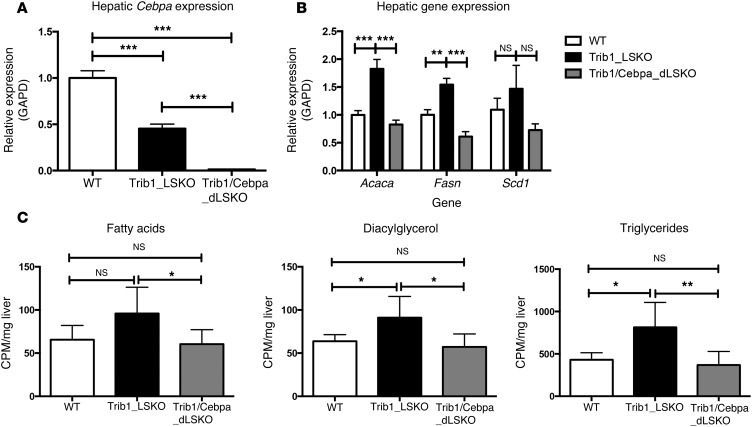
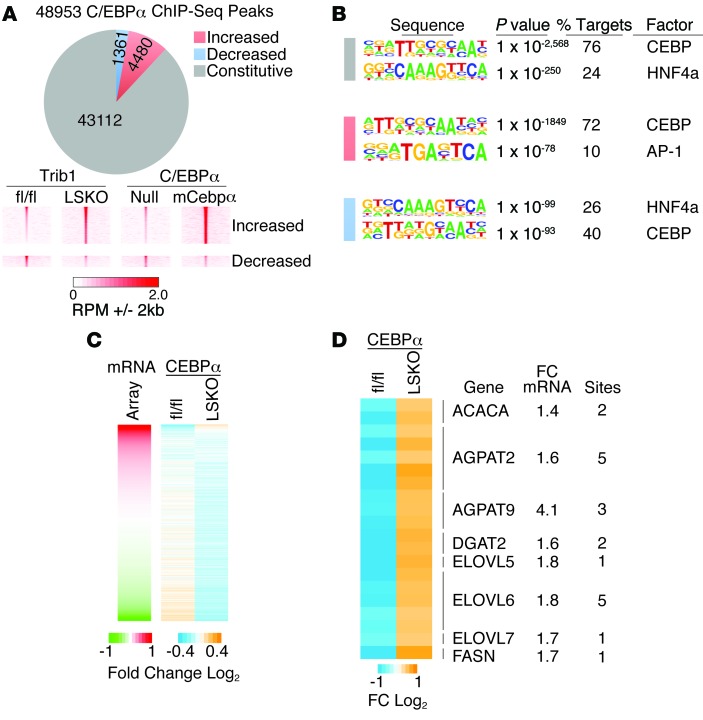
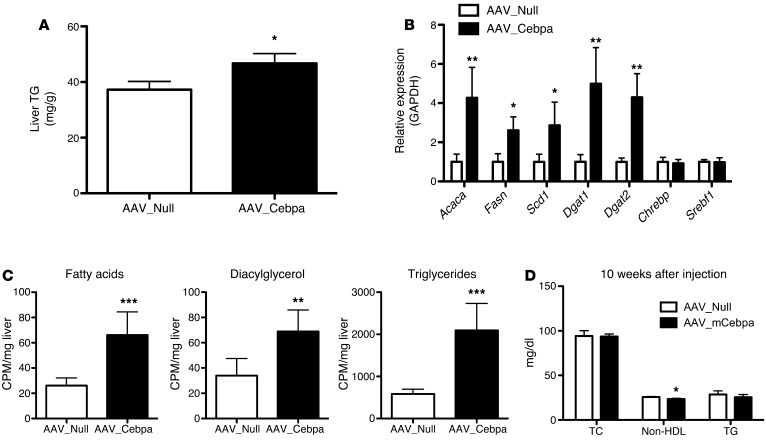
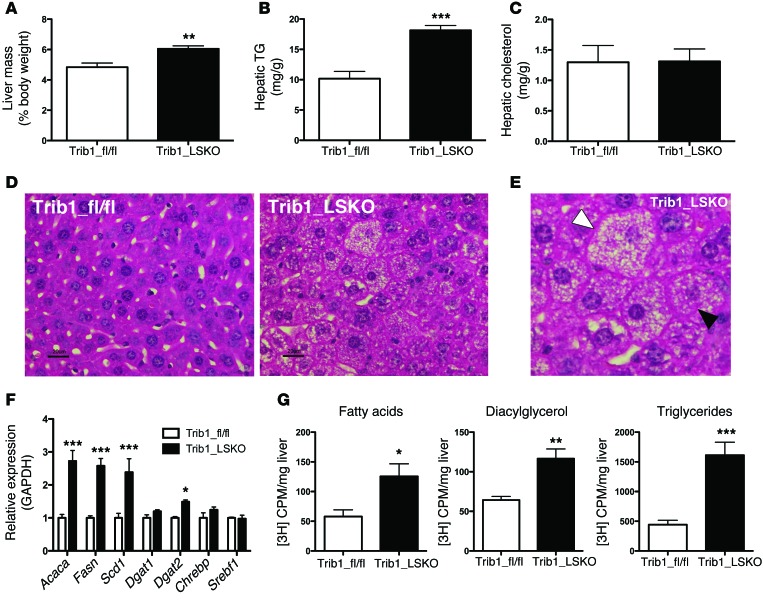
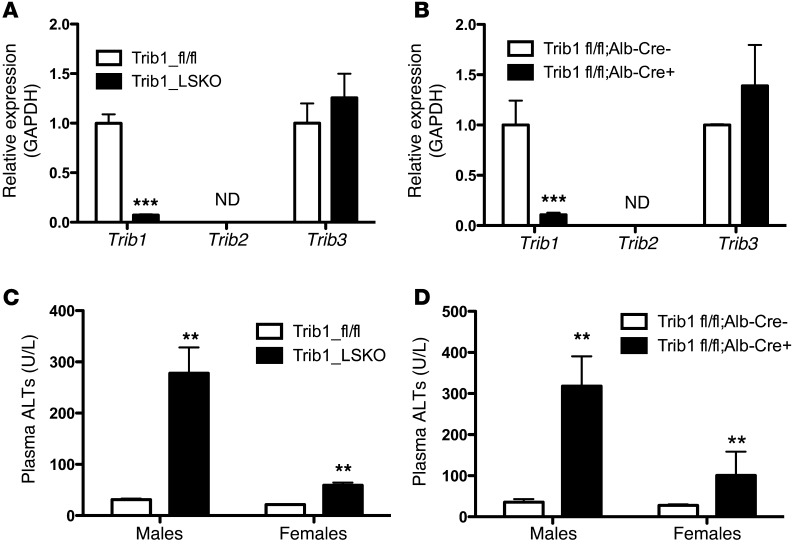
Variants near the gene TRIB1 are significantly associated with several plasma lipid traits, circulating liver enzymes, and the development of coronary artery disease in humans; however, it is not clear how its protein product tribbles-1 regulates lipid metabolism. Here, we evaluated mice harboring a liver-specific deletion of Trib1 (Trib1_LSKO) to elucidate the role of tribbles-1 in mammalian hepatic lipid metabolism. These mice exhibited increased hepatic triglyceride (TG) content, lipogenic gene transcription, and de novo lipogenesis. Microarray analysis revealed altered transcription of genes that are downstream of the transcription factor C/EBPα, and Trib1_LSKO mice had increased hepatic C/EBPα protein. Hepatic overexpression of C/EBPα in WT mice phenocopied Trib1_LSKO livers, and hepatic knockout of Cebpa in Trib1_LSKO mice revealed that C/EBPα is required for the increased lipogenesis. Using ChIP-Seq, we found that Trib1_LSKO mice had increased DNA-bound C/EBPα near lipogenic genes and the Trib1 gene, which itself was transcriptionally upregulated by C/EBPα overexpression. Together, our results reveal that tribbles-1 regulates hepatic lipogenesis through posttranscriptional regulation of C/EBPα, which in turn transcriptionally upregulates Trib1. These data suggest an important role for C/EBPα in mediating the lipogenic effects of hepatic Trib1 deletion and provide insight into the association between TRIB1 and plasma lipids, and liver traits in humans.


Figures

Figure 4
Figure 4. Loss of Hepatic Trib1 leads to increased C/EBPa and C/EBPb protein levels, as well as decreased transcript levels.
(A) Western blot analysis of C/EBPα, C/EBPβ, and β-actin levels in livers of Trib1_fl/fl and Trib1_LSKO mice. Whole-liver protein extracts were made in PBS + protease inhibitors, and proteins were size-separated by SDS-PAGE. (B) Real-time RT-PCR analysis of Cebpa and Cebpb hepatic transcript levels in Trib_fl/fl and Trib1_LSKO mice (n = 5) 4 weeks after injection. TaqMan Realtime RT-PCR was performed using commercially available gene-expression probes on cDNA made from 1 μg total liver RNA. Results in B were analyzed by Student’s t test (**P ≤ 0.01).
Figure 2
Figure 2. Trib1_LSKO mice have increased plasma TC, HDL and non-HDL cholesterol, and plasma TGs.
(A) Plasma TC, non-HDL cholesterol, and TG in male Trib1_fl/fl or Trib1_LSKO mice (n = 10) 4 weeks after injection. Plasma samples were collected after mice were fasted for 4 hours. (B) Plasma TC, non-HDL cholesterol, and TG after 4-hour fast in female Trib1_fl/fl and Trib1_LSKO mice (n = 10) 4 weeks after injection. (C) Plasma TC in male Trib1_fl/fl and Trib1_LSKO mice (n = 5) out to 20 weeks after injection. (D) Change from baseline for non-HDL cholesterol in the same male Trib1_fl/fl and Trib1_LSKO mice from C. All plasma levels were measured by Cobas-Mira autoanalyzer with commercially available reagents. Significance was determined in all panels by Student’s t test (*P ≤ 0.05, **P ≤ 0.01, ***P ≤ 0.001).
Figure 8
Figure 8. C/EBPα and TRIB1 are in a regulatory feedback loop that is both transcriptional and posttranslational.
(A) Differential C/EBPα binding peaks in the downstream region of Trib1 in Trib1_fl/fl, Trib1_LSKO, AAV_Null, and AAV_mCebpa mice, as measured by C/EBPα ChIP-Seq. n = 2 for this experiment, while only one mouse/group is shown. (B) Hepatic TRIB1 expression in AAV_Null and AAV_mCebpa mice (n = 5) 2 weeks after injection. (C) Schematic of the TRIB1- C/EBPα regulatory feedback loop. Results in B were analyzed by Student’s t test (**P ≤ 0.01).
Figure 6
Figure 6. C/EBPα is required for increased lipogenesis in Trib1_LSKO mice.
(A) Hepatic transcript levels of Cebpa in WT mice, Trib1_LSKO mice, or Trib1/Cebpa_dLSKO mice (n = 6) 2 weeks after injection with 1.5 × 10¹¹ gc of AAV-TBG-Cre. (B) Transcription of lipogenic genes in all 3 experimental groups. Gene expression values are relative to the Gapd housekeeping gene, with the WT group set to 1. (C) Production of fatty acids, diacylglycerol, and TG is shown in WT, Trib1_LSKO, and Trib1/Cebpa_dLSKO mice after injection with [3H]-acetate. Significance was determined in all panels by ANOVA followed by Tukey’s post-hoc test (*P ≤ 0.05, **P ≤ 0.01, ***P ≤ 0.001).
Figure 7
Figure 7. Trib1_LSKO mice have increased C/EBPα occupancy near lipogenic genes.
(A) Pie chart of all C/EBPα binding sites identified in liver by ChIP-seq showing the number of sites that were unchanged (constitutive), increased or decreased in Trib1_LSKO mice compared with Trib1_fl/fl mice. Density heat maps (lower panel) of raw sequence tags at regions differentially occupied by C/EBPα in Trib1_LSKO mice are shown for Trib1_fl/fl, Trib1_LSKO, AAV_Null, and AAV_mCebpa mice. (B) HOMER de novo motif analysis of constitutive and differential C/EBPα-binding sites in Trib1_LSKO mice. (C) Relationship of gene expression to C/EBPα occupancy. Left panel shows the relative expression of all genes in the microarray ordered from highest to lowest fold-change in Trib1_LSKO vs. fl/fl control. Right heat map depicts C/EBPα occupancy in Trib1_fl/fl and Trib1_LSKO mice at sites within 100 kb of the TSS. (D) Heat map of differential C/EBPα binding sites within 100 kb of the TSS for genes involved in hepatic lipogenesis. The number of C/EBPα sites and the microarray fold change are indicated on the right for each gene.
Figure 5
Figure 5. Overexpression of mCebpa in livers of mice phenocopies the increased hepatic TG synthesis observed in Trib1_LSKO mice.
(A) Liver TG content in mice receiving 1 × 10¹² AAV_Null or AAV_mCebpa 2 weeks after injection after overnight fast (n = 5). (B) Hepatic lipogenic gene expression in AAV_Null and AAV_mCebpa mice 2 weeks after injection, as measured by TaqMan real-time RT-PCR from 1 μg total RNA. Values are relative expression compared with GAPDH housekeeping gene. (C) De novo lipogenesis in mice from A after overnight fast, refeeding, and fatty acid labeling with [3H]-Acetate. (D) Plasma TC, non-HDL cholesterol, and TG were measured after a 4-hour fast in mice (n = 6) 10 weeks after AAV_Null or AAV_mCebpa injection. Significance was determined in all panels by Student’s t test (*P ≤ 0.05, **P ≤ 0.01, ***P ≤ 0.001).
Figure 3
Figure 3. Trib1_LSKO mice have increased hepatic TG content, transcription of fatty acid synthetic genes, and de novo lipogenesis.
(A) Liver mass of Trib1_fl/fl and Trib1_LSKO mice (n = 5) represented as percentage of body mass. (B) Liver TG content measured by colorimetric assay using 20 mg whole liver homogenized in PBS from Trib1_fl/fl and Trib1_LSKO mice 4 weeks after injection. (C) Liver cholesterol content measured by colorimetric assay from same liver homogenates used in B. (D) H/E staining of liver sections from Trib1_fl/fl and Trib1_LSKO mice 4 weeks after injection shows increased lipid deposition and breakdown of hepatocyte organization. (E) Enlarged image of steatotic liver from Trib1_LSKO mice. The white arrowhead indicates a hypertrophic hepatocyte with microvesicular steatosis, and the black arrowhead indicates a typical Mallory body. (F) Lipogenic gene transcription in livers of Trib1_fl/fl and Trib1_LSKO mice measured by TaqMan real-time RT-PCR (n = 5). (G) De novo lipogenesis in mice (n = 6) fasted overnight, then refed and injected with 100 μCi of [3H]-Acetate for labeling of newly synthesized fatty acids. Lipids were extracted from 100 mg liver, and values are CPM/mg liver. Scale bars: 20 µm. Significance was determined by Student’s t test (*P ≤ 0.05, **P ≤ 0.01, ***P ≤ 0.001).
Figure 1
Figure 1. Efficient deletion of Trib1, both somatic and germ-line, causes increased plasma ALTs.
(A) Hepatic transcript levels of Trib1-3 in mice (n = 5) receiving 1.5 × 10¹¹ gc of either AAV_Null (Trib1_fl/fl) or AAV-TBG-Cre (Trib1_LSKO) 4 weeks after injection. Transcript levels were measured by TaqMan real-time RT-PCR of cDNA made from 1 μg liver total RNA. ND, not detectable. (B) Hepatic message levels of Trib1-3 in Trib1fl/fl mice crossed onto the albumin-Cre background causing germline deletion of hepatic Trib1. Mice were all aged 8–10 weeks, n = 5. (C) Plasma ALTs in male and female Trib1_fl/fl and Trib1_LSKO mice 4 weeks after injection, as measured by Cobas-Mira autoanalyzer. (D) Plasma ALTs of Trib1fl/fl Alb-Cre – and Trib1fl/fl Alb-Cre + males and females (n = 5), aged 8–10 weeks. Significance was determined in all panels by Student’s t test (**P ≤ 0.01, ***P ≤ 0.001).

References

    1. Willer CJ, et al. Newly identified loci that influence lipid concentrations and risk of coronary artery disease. Nat Genet. 2008;40(2):161–169. doi: 10.1038/ng.76. - DOI - PMC - PubMed
    1. Teslovich TM, et al. Biological, clinical and population relevance of 95 loci for blood lipids. Nature. 2010;466(7307):707–713. doi: 10.1038/nature09270. - DOI - PMC - PubMed
    1. Global Lipids Genetics Consortium. et al. Discovery and refinement of loci associated with lipid levels. Nat Genet. 2013;45(11):1274–1283. doi: 10.1038/ng.2797. - DOI - PMC - PubMed
    1. Chambers JC, et al. Genome-wide association study identifies loci influencing concentrations of liver enzymes in plasma. Nat Genet. 2011;43(11):1131–1138. doi: 10.1038/ng.970. - DOI - PMC - PubMed
    1. CARDIoGRAMplusC4D Consortium. et al. Large-scale association analysis identifies new risk loci for coronary artery disease. Nat Genet. 2013;45(1):25–33. - PMC - PubMed

Publication types

MeSH terms