. 2015 Sep 1;470(2):169-79.
doi: 10.1042/BJ20131031. Epub 2015 Jun 11.

Role of N-glycosylation in renal betaine transport

Affiliations

Role of N-glycosylation in renal betaine transport

Eva S Schweikhard et al. Biochem J. .

Abstract

The osmolyte and folding chaperone betaine is transported by the renal Na(+)-coupled GABA (γ-aminobutyric acid) symporter BGT-1 (betaine/GABA transporter 1), a member of the SLC6 (solute carrier 6) family. Under hypertonic conditions, the transcription, translation and plasma membrane (PM) insertion of BGT-1 in kidney cells are significantly increased, resulting in elevated betaine and GABA transport. Re-establishing isotonicity involves PM depletion of BGT-1. The molecular mechanism of the regulated PM insertion of BGT-1 during changes in osmotic stress is unknown. In the present study, we reveal a link between regulated PM insertion and N-glycosylation. Based on homology modelling, we identified two sites (Asn(171) and Asn(183)) in the extracellular loop 2 (EL2) of BGT-1, which were investigated with respect to trafficking, insertion and transport by immunogold-labelling, electron microscopy (EM), mutagenesis and two-electrode voltage clamp measurements in Xenopus laevis oocytes and uptake of radiolabelled substrate into MDCK (Madin-Darby canine kidney) and HEK293 (human embryonic kidney) cells. Trafficking and PM insertion of BGT-1 was clearly promoted by N-glycosylation in both oocytes and MDCK cells. Moreover, association with N-glycans at Asn(171) and Asn(183) contributed equally to protein activity and substrate affinity. Substitution of Asn(171) and Asn(183) by aspartate individually caused no loss of BGT-1 activity, whereas the double mutant was inactive, suggesting that N-glycosylation of at least one of the sites is required for function. Substitution by alanine or valine at either site caused a dramatic loss in transport activity. Furthermore, in MDCK cells PM insertion of N183D was no longer regulated by osmotic stress, highlighting the impact of N-glycosylation in regulation of this SLC6 transporter.

Keywords: kidney; neurotransmitter:sodium symporter (NSS)/solute carrier 6 (SLC6) family; osmotic stress response; regulation; subcellular distribution; transport; γ-aminobutyric acid (GABA).


Figures

FIGURE 1
FIGURE 1. Sequence alignment and homology model of the NSS family transporter BGT-1
(A) Sequence alignment of representative NSS family members (human BGT1, SLC6A12, P48065; dog BGT1, SLC6A12, P27799; human GAT2, SLC6A13, Q9NSD5; human GAT3, SLC6A11, P48066; human GAT1, SLC6A1, P30531; human TauT, SLC6A6, P31641; human DAT, SLC6A3, Q01959; and Drosophila melanogaster DAT, PDB entry 4M48:A, which is truncated at residues 164–206 compared to SLC6A6, at the position indicated by *) with varying numbers of N-glycosylation sites in EL2. Six N-glycosylation sites are found in total, and are labelled 1–6 (red rectangles and bars). Conserved residues are coloured with increasingly dark blue backgrounds. (B, C) Homology model of BGT-1 based on dmDAT (PDB entry 4M48), shown as cartoons and viewed from the plane of the membrane, for (B) the whole protein, and (C) a close-up of the extracellular surface. Helices in the four-helix bundle containing transmembrane helices 1, 2, 6, and 7 are colored pink, while the transmembrane helices in the so-called scaffold are colored dark blue. Loops EL2 and EL4 are shown in orange and cyan, respectively. The segment of EL2 with the lowest confidence due to the lack of template during the modelling process is highlighted in yellow. Two sodium ions, one chloride ion and a GABA molecule are shown in the central binding sites as spheres (purple and green for sodium and chloride, respectively). The disulphide bridge formed by residues C157 and C166 is shown as orange sticks. The glycosylation sites N171 and N183 are shown as red sticks, while V188 and I365 are shown as orange and cyan sticks respectively.
FIGURE 2
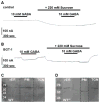
FIGURE 2. Response of BGT-1 to GABA in the presence of hypertonic conditions and membrane distribution of N-glycosylated and de-glycosylated BGT-1 in Xenopus oocytes
(A, B) Traces represent typical records as obtained using 7 oocytes from 2 different frogs. Oocytes were either injected with water (A) or BGT-1 RNA (B), clamped at a potential of −60 mV, and superfused with 10 mM GABA dissolved in ORi (black bar, 10 mM GABA). Hypertonic conditions were achieved by adding 220 mM sucrose to ORi (black bar, + 220 mM Sucrose) after which the effect of betaine (black bar, 10 mM GABA) was tested again. Under isotonic conditions, GABA only induced currents in the bgt1-expressing oocytes, specifically inward currents of −36.5±13.8 nA (B). Hypertonic conditions led to inward currents in both water-injected-(A) and BGT-1-RNA-injected oocytes (B), but GABA-mediated currents in bgt1-expressing oocytes were reduced under hypertonic conditions (−28.5±26.8 nA) in comparison to isotonic conditions. (C, D) Fractionation of oocyte membranes (80 oocytes of WT and 100 oocytes of WT+P) showing a distribution of (C) WT and (D) WT+P in the plasma membrane (PM), in the rough Endoplasmic Reticulum (rER), and in the trans-Golgi network (TGN) of oocytes.
FIGURE 3
FIGURE 3. Expression and distribution of BGT-1 and N-glycosylation site mutants in oocytes
(A) Western blot against BGT-1 specific antibody for oocyte membranes containing mutants treated with (+) and without PNGase F. Treatment of oocytes with PNGase F resulted in a 70 kDa glycosylated form (WT) and a 60 kDa deglycosylated isoform (WT, +). N171D treated with PNGase F (N171D, +) shows a shift similar to that observed for WT BGT-1, with a prominent band at 60 kDa. N183D shows a dramatically reduced amount of the glycosylated form at 70 kDa, but dominantly the un-glycosylated form at 60 kDa (N183D, +). NN171/183DD is detected at 60 kDa both with and without PNGase F (NNDD, +). N171A and N171V are still glycosylated before PNGase F, demonstrated by a band shift after PNGase F treatment. However, the extent of N-glycosylation is lower than for WT and N171D. The N183V mutant shows no shift upon PNGase F treatment, similar to the double mutant NN171/183DD. An exemplary Western blot is shown of three replicates. (B) Fractionation of oocyte membranes (150 oocytes of NN171/183D) showing the distribution of NN171/183DD in the plasma membrane (PM), in the rough Endoplasmic Reticulum (rER), and in the trans-Golgi network (TGN), where the latter shows minor degradation (arrow). An exemplary Western blot is shown of three replicates. (C) Immunogold-labelling of thin-sectioned oocytes containing WT, N171D, N183D and NN171/183DD reveal the abundance of the WT in the plasma membrane, whereas N171D and N183D are less abundant in the plasma membrane, and NN171/183DD is detected only in smaller amounts in the plasma membrane and stays mainly intracellular, in the rER. Micrographs are representative of a series of 20 identical experiments each (WT: 30 ± 5 gold-labeled BGT-1 molecules in a comparable section, N171D: 21 ± 3, N183D: 15 ± 2, NN171/183DD: 9 ± 1).
FIGURE 4
FIGURE 4. Membrane distribution of de-glycosylated BGT-1 in MDCK cells
(A) Western blot analysis of endogenous BGT-1 (WTend) before and after treatment with PNGase F (WTend+P) using a BGT-1 specific antibody reveal a band shift from 95 kDa (WTend) to 55 kDa (WTend+P). An exemplary Western blot is shown of three replicates. (B) Western blot of MDCK membranes expressing EGFP-BGT-1-WT using a GFP-tag reveals a fully glycosylated form of the BGT-1-WT at 120 kDa accounting for the 27 kDa EGFP-tag (WTEGFP) and a 95 kDa band of EGFP-BGT-1-WT after PNGase F treatment (WTEGFP+P). An exemplary Western blot is shown of three replicates. (C) EGFP-BGT-1-WT exposed to iso- (Iso) and hypertonic (Hyp) growth medium resulting in an increase of protein at the plasma membrane during hypertonicity. An exemplary Western blot is shown of three replicates. (D) Fluorescence microscopy of MDCK cells under iso- (Iso) and hypertonic (Hyp) conditions (24 hours) expressing BGT-1-WTEGFP demonstrates a clear subcellular distribution to the plasma membrane under hypertonicity. The same hypertonic conditions and treatment with PNGase F for 6 hours (Hyp+P) result in a partial redistribution of BGT-1-WT. (E) Distribution of both EGFP-BGT-1-WT and EGFP-BGT-1-WT treated with PNGase F for 6 hours in MDCK cells after 24 hours in hypertonic medium and then switched to fresh isotonic growth medium for further 24 hours (Hyprecovery, Hyp+Precovery). (Scale bar (D, E): 20 μm)
FIGURE 5
FIGURE 5. Activity of glycosylated BGT-1 and de-glycosylated BGT-1 in MDCK cells
KM-values of endogenous BGT-1 (filled circles) and de-glycosylated BGT-1 after PNGase F treatment (open squares) were obtained from the uptake rates of [3H]GABA in pmol per mg per min in MDCK cells. Each point shows the average of at least three independent experiments. The error bars represent a mean ±SD of three independent measurements. *P < 0.001, compared with controls (ANOVA).
FIGURE 6
FIGURE 6. Expression and distribution of N171D and N183D under iso- and hypertonic conditions in MDCK cells
(A, B) Western blot analysis and fluorescence microscopy of N183D under iso- (Iso) and hypertonic (Hyp) conditions show a decrease in its expression during hypertonic growth conditions. Under isotonic conditions (Iso) N183D is located in the plasma membrane and intracellular whereas under hypertonic conditions (Hyp) the overall amount is strongly reduced. An exemplary Western blot is shown of three replicates. (C, D) Western blot analysis and fluorescence microscopy of N171D under iso- (Iso) and hypertonic (Hyp) conditions show an increase in its expression during hypertonic growth conditions. Under isotonic conditions (Iso) N171D is primary located intracellular whereas under hypertonic conditions (Hyp) the mutant is found in the plasma membrane similar to EGFP-BGT1. (Scale bar: 20 μm). An exemplary Western blot is shown of three replicates.

Similar articles

References

    1. Burg MB. Molecular basis of osmotic regulation. Am J Physiol Renal Physiol. 1995;268:F983–996. - PubMed
    1. Kwon HM, Handler JS. Cell volume regulated transporters of compatible osmolytes. Curr Opin Cell Biol. 1995;7:465–471. - PubMed
    1. Beck FX, Burger-Kentischer A, Muller E. Cellular response to osmotic stress in the renal medulla. Pflügers Arch. 1998;436:814–827. - PubMed
    1. Bourque CW. Central mechanisms of osmosensation and systemic osmoregulation. Nat Rev Neurosci. 2008;9:519–531. - PubMed
    1. Haussinger D. The role of cellular hydration in the regulation of cell function. Biochemical Journal. 1996;313:697–710. - PMC - PubMed

Publication types

MeSH terms