. 2015 Sep 1;470(2):207-21.
doi: 10.1042/BJ20150404. Epub 2015 Jul 9.

GSK3-mediated raptor phosphorylation supports amino-acid-dependent mTORC1-directed signalling

Affiliations

GSK3-mediated raptor phosphorylation supports amino-acid-dependent mTORC1-directed signalling

Clare Stretton et al. Biochem J. .

Abstract

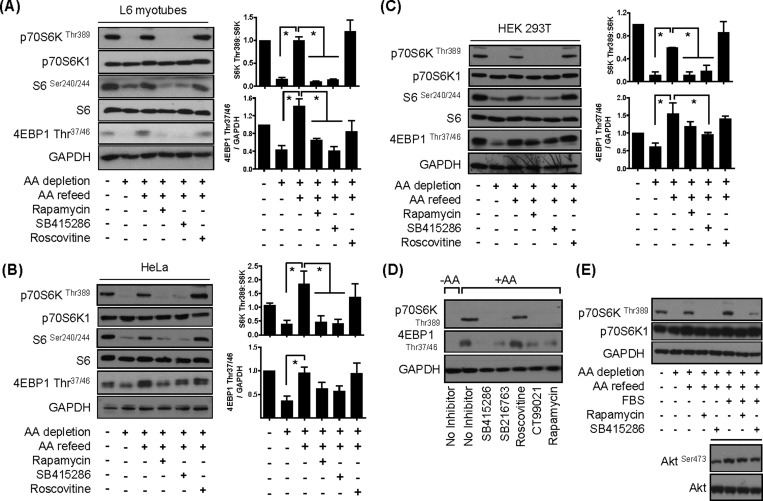
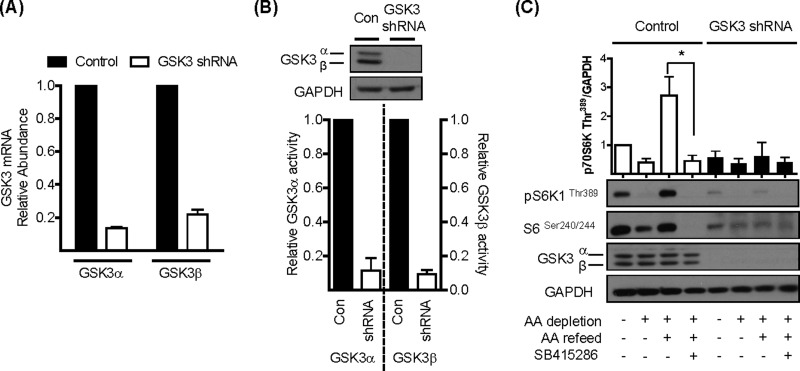
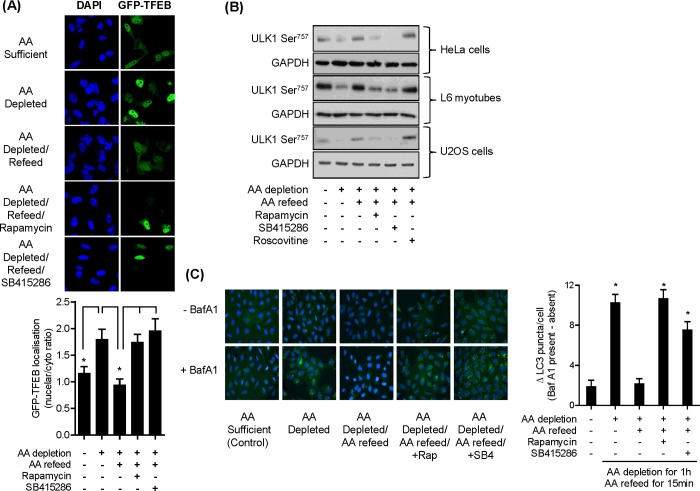
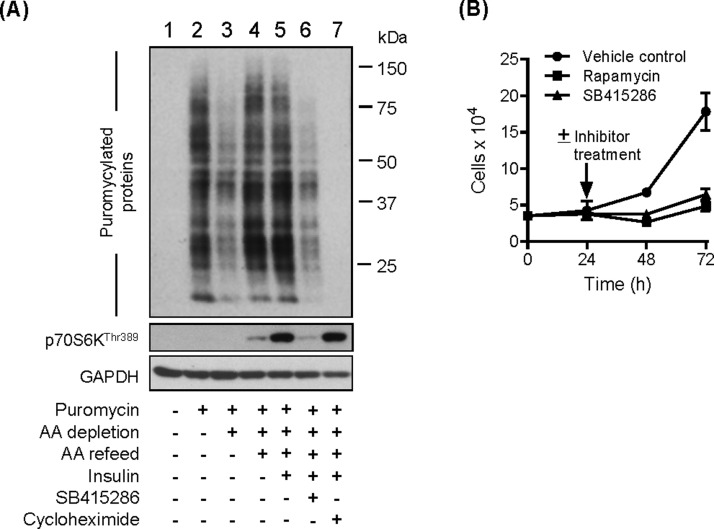
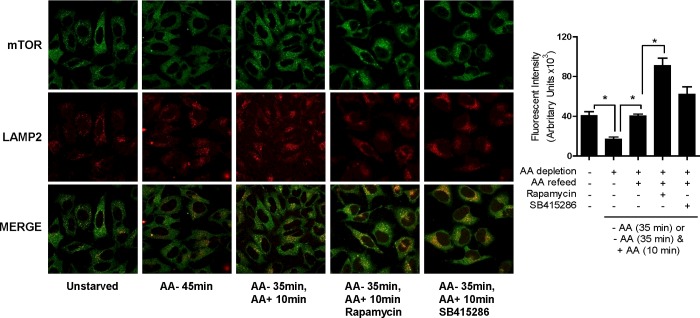
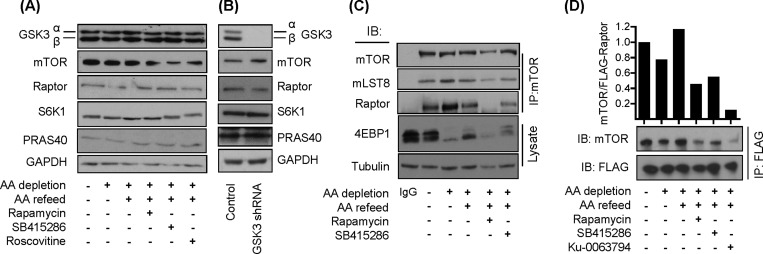
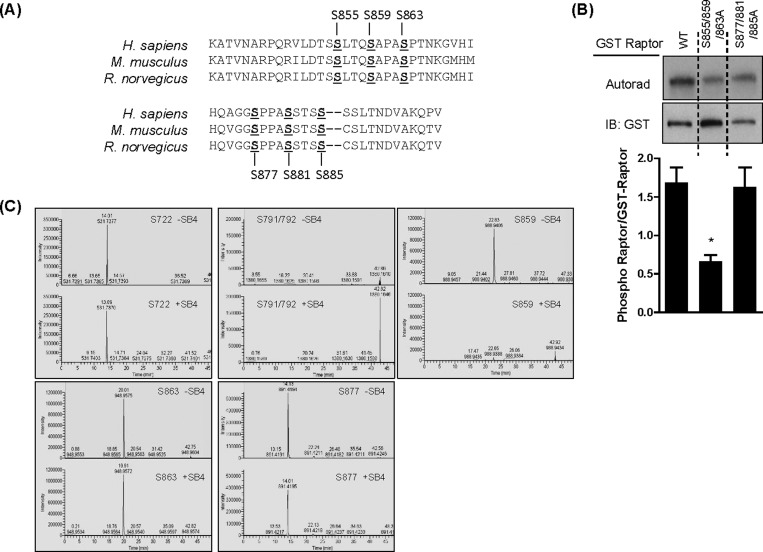
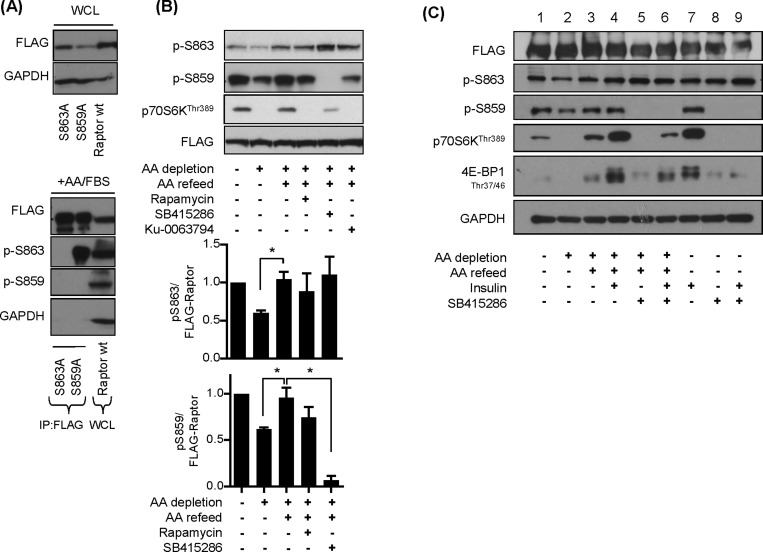
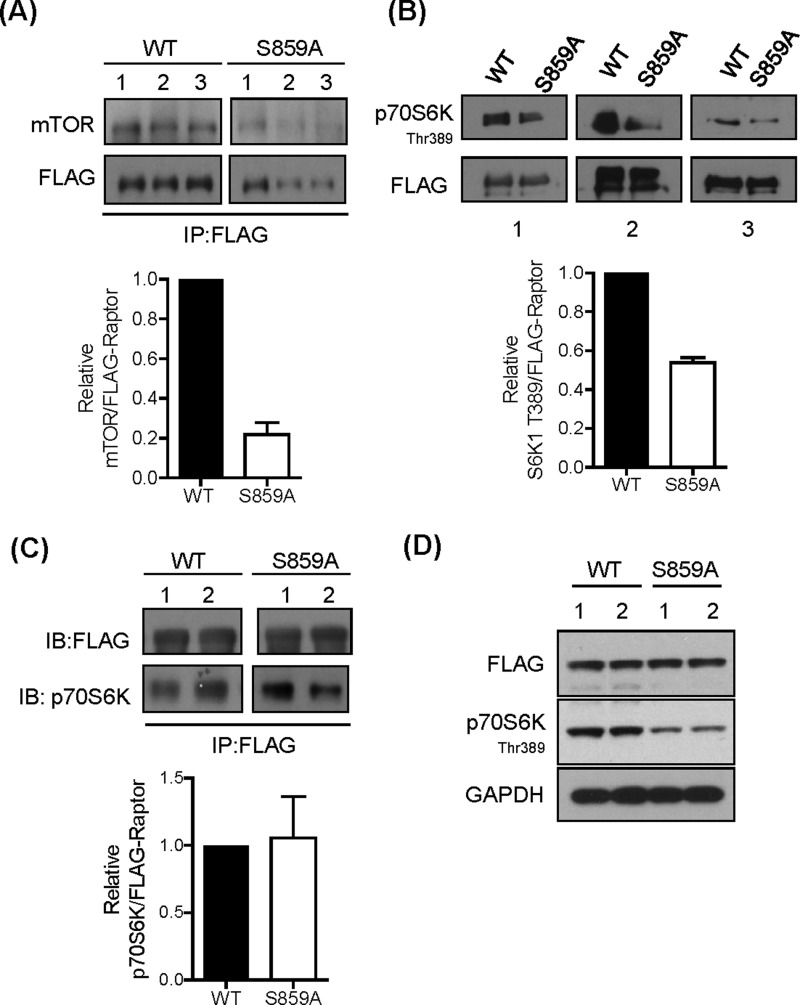
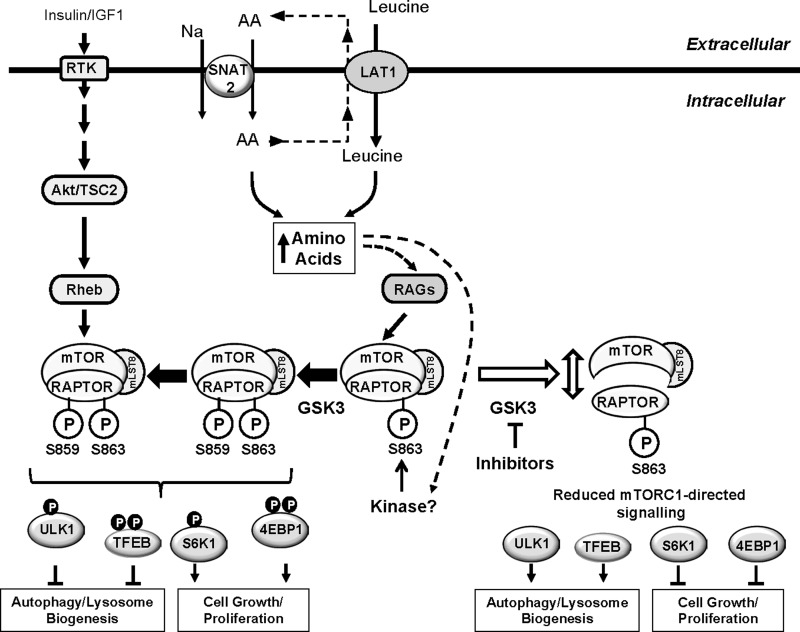
The mammalian or mechanistic target of rapamycin (mTOR) complex 1 (mTORC1) is a ubiquitously expressed multimeric protein kinase complex that integrates nutrient and growth factor signals for the co-ordinated regulation of cellular metabolism and cell growth. Herein, we demonstrate that suppressing the cellular activity of glycogen synthase kinase-3 (GSK3), by use of pharmacological inhibitors or shRNA-mediated gene silencing, results in substantial reduction in amino acid (AA)-regulated mTORC1-directed signalling, as assessed by phosphorylation of multiple downstream mTORC1 targets. We show that GSK3 regulates mTORC1 activity through its ability to phosphorylate the mTOR-associated scaffold protein raptor (regulatory-associated protein of mTOR) on Ser(859). We further demonstrate that either GSK3 inhibition or expression of a S859A mutated raptor leads to reduced interaction between mTOR and raptor and under these circumstances, irrespective of AA availability, there is a consequential loss in phosphorylation of mTOR substrates, such as p70S6K1 (ribosomal S6 kinase 1) and uncoordinated-51-like kinase (ULK1), which results in increased autophagic flux and reduced cellular proliferation.

Keywords: L-type (leucine) amino acid transporter 1 (LAT1); amino acid; autophagy; growth; insulin; leucine; p70S6K1; proliferation; sodium-coupled neutral amino acid transporter 2 (SNAT2); transcription factor EB (TFEB); uncoordinated-51-like kinase (ULK1).


Figures

Figure 1
Figure 1. Effect of GSK3 inhibitors on mTORC1 signalling in L6 myotubes, HeLa and HEK293T cells
(AC) Cells were held in EBSS containing or lacking AAs for 1 h or alternatively having been depleted of AAs incubated in EBSS containing a 1× AA mix (refeed) for 15 min. Cells were incubated with 100 nM rapamycin, 50 μM SB415286 or 30 μM roscovitine for 15 min prior to and for 15 min during the AA-refeed period. Cells were lysed and 30 μg of lysate protein was analysed by immunoblotting. Blots shown in (AC) are representative of a minimum of three independent experiments and histograms (means ± S.E.M., *P<0.05) show quantification of these. (D) L6 myotubes were AA-depleted for 1 h in EBSS followed by incubation in EBSS+AA for 15 min in the absence or presence of 50 μM SB415286, 10 μM SB216763, 30 μM roscovitine, 40 μM CT99021 or 100 nM rapamycin for 0.5 h. Cells were harvested and 30 μg of protein was analysed by immunoblotting using the antibodies indicated. (E) HEK293T cells were subjected to AA-depletion/refeeding as in (AC) or incubated with EBSS supplemented with serum [10% (v/v) FBS] ± 100 nM rapamycin or 50 μM SB415286 for 0.5 h, as indicated. Cells were lysed and 30 μg of protein was analysed by immunoblotting using the antibodies indicated.
Figure 2
Figure 2. Effects of shRNA-mediated gene silencing of GSK3α/β upon mTORC1-directed signalling
(A) Total RNA was extracted from L6 myotubes stably expressing either a non-specific shRNA or shRNAs targeting GSK3α and GSK3β. cDNA was synthesized from the mRNA and relative GSK3 mRNA abundance, as measured against GAPDH mRNA, assessed by quantitative PCR. (B) Lysates were prepared from L6 myotubes stably expressing either a non-specific shRNA or shRNAs targeting GSK3α and GSK3β. A 30 μg amount of lysate was analysed by immunoblotting using anti-GSK3α/β or anti-GAPDH antibodies. In addition, 100 μg of lysate was also subjected to immunoprecipitation using antibodies against either GSK3α or GSK3β and analysis of the respective GSK3 activities carried out using a phospho-GS peptide as a substrate. (C) L6 myotubes stably expressing either a non-specific shRNA or shRNAs targeting GSK3α and GSK3β were held in EBSS containing or lacking AA for 1 h or alternatively having been depleted of AAs incubated in EBSS containing a 1× physiological AA mix (refeed) for 15 min in the absence or presence of 50 μM SB415286. Cells were harvested and 30 μg of lysate was analysed by immunoblotting using the antibodies indicated. The asterisk indicates a significant (P<0.05) change between the indicated bars.
Figure 3
Figure 3. Effects of AA depletion/repletion and GSK3 inhibition upon markers of lysosomal biogenesis and autophagy
(A) HeLa cells were cultured on coverslips and transfected with GFP-tagged TFEB. Twenty-four hours post transfection, cells were incubated in EBSS and EBSS+AA in the absence or presence of 100 nM rapamycin or 50 μM SB415286 as indicated and cells were fixed, imaged and analysed as described in the Materials and methods section. Asterisks indicate significant (P<0.05) changes between indicated bars. (B) HeLa cells, L6 myotubes and U2OS cells were subjected to incubation with EBSS containing or lacking AAs for 1 h or alternatively having been depleted of AAs incubated in EBSS containing a 1× AA mix (refeed) for 15 min in the absence/presence of 100 nM rapamycin, 50 μM SB415286 or 30 μM roscovitine as indicated. Cells were lysed and 30 μg of lysate protein was analysed by immunoblotting. (C) U20S cells were incubated as in (B) but in the absence or presence of 50 nM bafilomycin A1. Cells were fixed and nuclei (blue DAPI) and LC3 puncta (green fluorescence) visualized as described in the Materials and methods section. Asterisks indicate a significant difference between the indicated bars (A) or indicate a significant difference in LC3 puncta observed relative to the untreated AA-sufficient control (P<0.05).
Figure 4
Figure 4. Effect of SB415286 on protein synthesis and cell growth
(A) HeLa cells were incubated in EBSS containing or lacking AA for 3 h or alternatively having been depleted of AAs incubated in EBSS containing 1× AA mix (refeed) ± 100 nM insulin for 30 min. Cells were incubated with 50 μM SB415286 or 50 μg/ml cycloheximide during the AA depletion and refeed period. Puromycin (1 μM) was added 30 min prior to cell harvest. Cells were lysed and 30 μg of protein was analysed by immunoblotting using antibodies against puromycin or the proteins indicated. (B) HEK293T cells were seeded at a density of 3.5 × 104 and treated 24 h post-seeding with vehicle solution and either 100 nM rapamycin or 50 μM SB415286 for up to 72 h. Cell number was quantified as described in the Materials and methods section.
Figure 5
Figure 5. Effect of SB415286 and rapamycin on mTOR localization
HeLa cells were cultured in EBSS containing or lacking AA or alternatively having been depleted of AAs incubated in EBSS containing a 1× AA mix (refeed) for the times indicated. In some cases, cells were incubated with 100 nM rapamycin or 50 μM SB415286 for 15 min prior to and for 10 min during the AA-refeed period as indicated. Cells were fixed, and fluorescent labelling and quantification of mTOR co-localization with LAMP2 was carried out as described in the Materials and methods section. Image quantification (means ± S.E.M.) is based on data from at least ten different fields of view. Asterisks indicate significant (P<0.05) differences between indicated bars.
Figure 6
Figure 6. Effects of GSK3 inhibition or shRNA-mediated GSK3α/β silencing on expression of proteins involved in mTOR signalling
(A and B) L6 myotubes were either held in EBSS containing or lacking AAs for 1 h or alternatively, having been AA-depleted, incubated in EBSS containing a 1× AA mix (refeed) for 15 min. Cells were incubated with 100 nM rapamycin, 50 μM SB415286 or 30 μM roscovitine for 15 min prior to and for 15 min during the AA-refeed period as indicated prior to cell lysis. Alternatively, L6 myotubes stably expressing non-specific shRNA or shRNAs targeting GSK3α/GSK3β were lysed for analysis. A 30 μg amount of lysate was analysed by immunoblotting using the antibodies indicated. (C) Effect of GSK3 inhibition on raptor and mLST8 association with mTOR and 4E-BP1 phosphorylation. HEK293T cells were incubated in EBSS lacking or containing AAs and inhibitors as in (A). Cells were lysed, the lysate was used to immunoprecipitate mTOR, and immunoprecipitates were analysed for proteins indicated. Alternatively, 30 μg of lysate was used for SDS/PAGE and immunoblot analysis of 4E-BP1 or tubulin (gel loading control). (D) HEK293T cells overexpressing FLAG–raptor were incubated with EBSS ± AAs as described in (A) above and with 100 nM rapamycin, 50 μM SB415286 or 1 μM Ku-0063794, as indicated. Cells were lysed and raptor was immunoprecipitated using anti-FLAG antibodies prior to immunoblotting with anti-mTOR and anti-FLAG antibodies.
Figure 7
Figure 7. Identification of GSK3-mediated raptor phosphorylation sites
(A) Alignment of AA sequence of raptor in Homo sapiens, Mus musculus and Rattus norvegicus showing conserved putative GSK3 serine phosphorylation sites. (B) HEK293T cells over expressing either GST-tagged wt raptor or GST-tagged mutant raptor were lysed, and GST-tagged raptor was immunoprecipitated. Phosphorylation of the tagged raptor proteins by GSK3β was analysed as described in the Materials and methods section. Analysis of gel loading was confirmed by subsequent blotting of the membrane using anti-GST antibody. *P<0.05, significant difference in the ratio of phosphorylation to total GST–raptor compared with wt raptor. (C) HEK293T cells were incubated for 1 h in EBSS containing AAs in the absence or presence of 50 μM SB415286. Cells were lysed and phosphorylation of raptor was analysed by MS, as described in the Materials and methods section.
Figure 8
Figure 8. Effects of AA and insulin on raptor and p70S6K1 phosphorylation
(A) HEK293T cells overexpressing FLAG–raptor, FLAG–raptor S859a or FLAG–raptor S863A mutant were lysed and FLAG-conjugated proteins were immunoprecipitated using anti-FLAG antibodies. Immunoprecipitates and 30 μg of lysate respectively were analysed by immunoblotting for the proteins indicated. (B) HEK293T cells overexpressing FLAG–raptor were incubated in EBSS containing or lacking AA for 1 h or alternatively having been depleted of AAs incubated in EBSS containing 1× AA mix (refeed) for 15 min. Cells were incubated with 100 nM rapamycin, 50 μM SB415286 or 1 μM Ku-0063794 for 15 min prior to and for 15 min during the AA-refeed period where indicated. Cells were harvested and 30 μg of protein was analysed by immunoblotting using the antibodies indicated. The lower panel represents quantification of Ser863 and Ser859 phosphorylation from at least three separate experiments (means ± S.E.M.) (C) HEK293 cells overexpressing FLAG–raptor were incubated in EBSS containing or lacking AA for 1 h ± 100 nM insulin (15 min) or alternatively having been depleted of AAs incubated in EBSS containing 1× AA mix (refeed) for 15 min ± 100 nM insulin. Cells were incubated with 50 μM SB415286 for 15 min prior to and for 15 min during the AA refeed period where indicated. Cells were harvested and 30 μg of protein was analysed by immunoblotting using the antibodies indicated.
Figure 9
Figure 9. Raptor–mTOR–S6K1 association and mTORC1 signalling
(A) HEK293T cells overexpressing FLAG–raptor or FLAG–raptor S859A were lysed and FLAG-tagged raptor variants were immunoprecipitated using anti-FLAG antibodies. Immunoprecipitates were analysed by immunoblotting using antibodies against mTOR and FLAG. Three separate experiments were performed. The histogram shows quantification of mTOR co-immunoprecipitated with wt and S859A mutant FLAG–raptor. (B) HEK293T cells overexpressing FLAG–raptor or FLAG–raptor S859A mutant were lysed and raptor was immunoprecipitated using anti-FLAG antibody. Raptor-associated mTOR kinase activity was assayed as described in the Materials and methods section using kinase-inactive recombinant p70S6K1 as substrate followed by immunoblotting using the antibody against phospho-70S6K1. The histogram shows quantification of p70S6K phosphorylation in relation to immunoprecipitated wt and S859A mutant FLAG–raptor. (C) HEK293T cells overexpressing FLAG–raptor or FLAG–raptor S859A were incubated for 1 h in EBSS containing 1× AA mix. Cells were lysed and FLAG-tagged raptor variants were immunoprecipitated using anti-FLAG antibody. Immunoprecipitates were analysed by immunoblotting for the proteins indicated. The histogram shows quantification of p70S6K that is co-immunoprecipitated with wt and S859A mutant FLAG–raptor from three independent experiments. (D) HEK293T cells overexpressing FLAG–raptor or FLAG–raptor S859A mutant were lysed and 30 μg of protein was analysed by immunoblotting for the proteins indicated.
Figure 10
Figure 10. Scheme showing GSK3 involvement in the regulation of mTORC1-directed signalling
AA provision regulates RAG-mediated recruitment of the mTORC1 complex to the lysosomal membrane, but also induces phosphorylation of the mTOR scaffold protein raptor on Ser863 by an unknown kinase. Phosphorylation of Ser863 primes phosphorylation of Ser859 by GSK3, which supports mTOR–raptor interaction and mTOR-catalysed phosphorylation of multiple downstream targets such as ULK1 and TFEB (thereby suppressing autophagy/lysosomal biogenesis) and p70S6K1 and 4E-BP1 (which support cell growth and proliferation). GSK3 inhibition leads to a loss in raptor Ser859 phosphorylation, reduced mTOR and raptor association and concomitant reduction in mTORC1-directed signalling. Activation of mTORC1 is subject to enhancement by insulin that induces activation of the mTORC1 complex via the Akt–TSC2–Rheb axis. This axis appears not to influence raptor phosphorylation on Ser863 or Ser859.

References

    1. Dibble C.C., Manning B.D. Signal integration by mTORC1 coordinates nutrient input with biosynthetic output. Nat. Cell Biol. 2013;15:555–564. doi: 10.1038/ncb2763. - DOI - PMC - PubMed
    1. Bar-Peled L., Sabatini D.M. Regulation of mTORC1 by amino acids. Trends Cell Biol. 2014;24:400–406. doi: 10.1016/j.tcb.2014.03.003. - DOI - PMC - PubMed
    1. Inoki K., Li Y., Xu T., Guan K.L. Rheb GTPase is a direct target of TSC2 GAP activity and regulates mTOR signaling. Genes Dev. 2003;17:1829–1834. doi: 10.1101/gad.1110003. - DOI - PMC - PubMed
    1. Inoki K., Li Y., Zhu T., Wu J., Guan K.L. TSC2 is phosphorylated and inhibited by Akt and suppresses mTOR signalling. Nat. Cell Biol. 2002;4:648–657. doi: 10.1038/ncb839. - DOI - PubMed
    1. Smith E.M., Finn S.G., Tee A.R., Browne G.J., Proud C.G. The tuberous sclerosis protein TSC2 is not required for the regulation of the mammalian target of rapamycin by amino acids and certain cellular stresses. J. Biol. Chem. 2005;280:18717–18727. doi: 10.1074/jbc.M414499200. - DOI - PubMed

Publication types

MeSH terms