. 2015 Sep 8:5:13755.
doi: 10.1038/srep13755.

Epigenetic Regulation of Antibody Responses by the Histone H2A Deubiquitinase MYSM1

Affiliations

Epigenetic Regulation of Antibody Responses by the Histone H2A Deubiquitinase MYSM1

Xiao-Xia Jiang et al. Sci Rep. .

Abstract

B cell-mediated antibody response plays critical roles in protective immunity, as well as in the pathogenesis of allergic and autoimmune diseases. Epigenetic histone and DNA modifications regulate gene transcription and immunity; however, so far, little is known about the role of epigenetic regulation in antibody responses. In this study, we found that mice deficient in the histone H2A deubiquitinase MYSM1, despite their severe defect in B cell development, exhibit an enhanced antibody response against both T cell-dependent and independent antigens. We revealed that MYSM1 intrinsically represses plasma cell differentiation and antibody production. Mechanistic studies demonstrated that MYSM1 is a transcriptional activator of Pax5, the repressors of plasma cell differentiation, by facilitating key transcriptional factor recruitment and coordinating histone modifications at the Pax5 loci. Hence, this study uncovers a critical role for MYSM1 in epigenetically repressing plasma cell differentiation and antibody production, in addition to its opposing, active role in B cell development. Importantly, this study further provides a new target and strategy to modulate antibody production and responses with profound therapeutic implications.


Figures
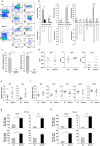
Figure 1
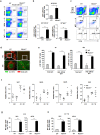
Figure 1. Enhanced primary TI and TD antibody responses in Mysm1−/− mice despite the severe defect in FO B cell development.
(a) Representative flow cytometry analysis of WT and Mysm1−/− splenocytes stained with indicated antibodies from four independent experiments. Numbers are the percentage of events within the indicated gates. (b) Absolute numbers (top) of indicated B cell subsets in spleen of Mysm1−/− mice and WT littermates and fold reduction (bottom) of Mysm1−/− cell numbers compared to WT cell numbers (n = 5–8 per group) from one of three independent experiments. **P < 0.01, WT vs. Mysm1−/−. (c) Graphs show the absolute numbers of B220+ B cells in the spleen (left) and bone marrow (right) from WT and Mysm1−/− mice. **P < 0.01, WT vs. Mysm1−/−. (d) Serum from naïve WT and Mysm1−/− mice was analyzed for resting levels of IgM, IgG3, and IgG1 by ELISA. (e) Mice were immunized with NP-Ficoll (50 μg) and serum was collected at day 14 for examining NP-specific IgM and IgG3 levels by ELISA with plates coated with NP26-BSA. (f) WT and Mysm1−/− mice were immunized with NP-KLH (100 μg) precipitated in Alum. Serum was harvested at day 14 after immunization to quantitate NP-specific IgM, IgG3, IgG1, IgG2a, and IgG2b antibodies by ELISA. (g,h) ELISPOT analysis of anti-NP IgM (top) and IgG (bottom) production by cells pooled from spleens or lymph nodes of WT and Mysm1−/− mice 14 d after immunization with NP-Ficoll (g) or NP-KLH (h). **p < 0.01, *p < 0.05, Mysm1−/− vs. WT.
Figure 2
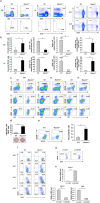
Figure 2. Enhanced recall TD antibody responses in Mysm1−/− mice.
(a,b) Flow cytometry analysis of splenocytes of WT and Mysm1−/− mice 14 days after intraperitoneal immunization with NP-KLH (100 μg) in alum. PICD4CD8Gr-1 cells were analyzed for NP+CD138+, NP+B220+, and NP+IgG1+ cells (a). Numbers indicate the percent in each. Absolute cell numbers of NP+B220+ B cells, NP+CD138+ plasma cells, and NP+IgG+ antibody-producing cells per million B220+ cells for each group (n = 5–8 per group) 14 days after primary intraperitoneal immunization with NP-KLH (100 μg) precipitated in alum from one of three independent experiments (b). **P < 0.01, WT vs. Mysm1−/−. (c) Flow cytometry analysis of splenocytes 14 days after intraperitoneal immunization with NP-KLH in alum. Isotype-switched B cells (IgMIgDGr1CD138B220+) were analyzed for NP+IgG1+ status with NP+IgG1+ cells being subdivided into GC (CD38) and memory (CD38+) B cells. Numbers in plots and histograms represent percentage of cells within the gate. (d) Frozen spleen sections from WT and Mysm1−/− mice 14 days after immunization with NP-KLH, stained with antibodies to B220 to identify follicles (red) and GL7 for germinal centers (green). Original magnification is x10 (top) and x20 (bottom). (e) Frequencies of total (NP26) and high-affinity (NP4) NP-specific-secreting ASCs in spleen and bone marrow examined by ELISOPT assays. Data are the mean ± SEM of triplicate wells, with four to six mice in each group. **P < 0.01, WT vs. Mysm1−/−. (f) Mice were immunized with NP-KLH (100 μg in alum) and boosted with NP-KLH (50 μg in PBS) 42 days later. Serum was collected before boost immunization and 5 days after boost and analyzed by ELISA with NP26-BSA-coated plates for detecting NP-specific IgG1, IgG2a, IgG2b, and IgG3 antibodies. (g,h) Frequencies of total (NP26) and high-affinity (NP4) NP-specific-IgG1 secreting cells (ASCs) in spleen 42 days after primary immunization (g) and day 5 after boost (h). Data are the mean ± SEM of triplicate wells, with four to six mice in each group, and representative of two experiments. **p < 0.01, Mysm1−/− vs. WT.
Figure 3
Figure 3. MYSM1 intrinsically represses plasma cell differentiation.
(a) Representative flow cytometric analysis of CD138+ plasma cells in the bone marrow (BM), spleen (SP), draining lymph node (dLN), and mesenteric lymph node (mLN) of naive WT and Mysm1−/− mice. Numbers are the percentage of events within the indicated gates. (b) Graphs show the percent of CD138+ plasma cells, total number of CD138+ cells, total number of B220+ cells, and CD138+ cells per million B cells in bone marrow (top) or spleen (bottom) of naïve WT and Mysm1−/− mice (n = 5–8 per group). **P < 0.01, WT vs. Mysm1−/−. (c) Flow cytometric analysis of indicated surface markers in the bone marrow, spleen, and lymph node of WT and Mysm1−/− mice 14 days after NP-KLH immunization. (d) Splenic B cells from WT and Mysm1−/− mice immunized with NL-KLH were cultured in 96-well plate. Spot numbers (top) and representative spots (bottom) in the indicated cultures from triplicate wells ± SEM are shown from one of two independent experiments. **P < 0.01, WT vs. Mysm1−/−. (e) Enhanced spontaneous differentiation of plasma cells from naïve splenic Mysm1−/− B cells in vitro. Splenic B220+ B cells from WT and Mysm1−/− mice were cultured with IL-4 (10 ng/ml) for 4 days. Representative flow cytometric analysis is shown (n = 5–8 per group). **P < 0.01, WT vs. Mysm1−/−. (f) Enhanced plasma cell differentiation of Mysm1−/− B cells after LPS stimulation in vitro. Splenic B220+ cells from WT and Mysm1−/− mice were cultured with LPS (20 μg/ml) and were collected at indicated days for flow cytometric analysis. (g,h) MYSM1 rescue assays. Splenic B220+ cells from Mysm1−/− mice were transduced with a recombinant lentiviral vector LV-MYSM1 or control vector LV-CONT. The transduced cells were subjected to flow cytometric analysis with indicated antibodies after LPS (20 μg/ml) stimulation in vitro (g). Quantitative RT-PCR analysis of MYSM1, Blimp1, and Xbp1 mRNA levels in Mysm1−/− splenic B220+ cells transduced with LV-CONT or LV-MYSM1 (h). Data were normalized to Hprt and are presented as relative to that of control LV-CONT sample, set as 1, from one of two independent experiments. **p < 0.01, LV-CONT vs. LV-MYSM1.
Figure 4
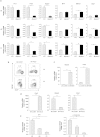
Figure 4. MYSM1 intrinsically represses Ig production by plasma cells.
(a) Plasma cells (CD138+) from naïve WT and Mysm1−/− mice were cultured at 10,000 cells/well in triplicate. Supernatants were collected at 36 h and were assayed for total IgM, IgG3, and IgG1 secretion by ELISA. (bd) Supernatant ELISA analysis of NP-specific (b), MUC1-specific (c), or OVA-specific (d) IgG1, IgG3, and IgG2b secretion in sorted CD138+ cells from WT and Mysm1−/− mice that were immunized with the indicated antigens in alum. CD138+ cells were seeded at 10,000 cells/well in triplicate and the supernatants were harvested after 36 h of culture. (e) Quantitative RT-PCR analysis of mRNA levels of indicated genes in sorted CD138+ cells from WT and Mysm1−/− mice. Data were normalized to Hprt and is presented as relative to that of WT sample, set as 1, from one of two independent experiments. **p < 0.01, Mysm1−/− vs. WT.
Figure 5
Figure 5. Reduced expression of Pax5 and Bach2 and increased expression of Blimp1 and Xbp1 in Mysm1−/− B cells.
(a) qRT-PCR analysis of mRNA levels of representative genes in sorted WT and Mysm1−/− cells. Naive splenic B220+ cells (nB) from WT and Mysm1−/− mice were stimulated with LPS (20 μg/ml) in vitro and, 5 days later, LPS-activated B cells (aB, B220+CD138) and plasma cells (PC, CD138+ B220+/−) were sorted by FACS. Relative mRNA levels were normalized by Hprt mRNA expression and calculated relative to the mRNA expression seen in the WT cells, set as 1. Data are representative of three independent experiments. **P < 0.01, *P < 0.05, WT vs. Mysm1−/−. (b) Forced expression of Pax5 reversed the enhanced plasma cell differentiation from Mysm1−/− B cells in vitro. Splenic B220+ cells from Mysm1−/− mice were transduced with a recombinant retroviral vector that expresses mouse Pax5, or control vector (RV-CONT). The transduced cells were stimulated with LPS (20 μg/ml), and, 2 and 4 days later, flow cytometric analysis was performed with indicated antibodies. (c) Enhanced expression of endogenous Pax5 by forced expression of MYSM1. Mysm1−/− B cells were transduced with LV-MYSM1 or control vector, and 24 hr later mRNA were isolated for qRT-PCR. Relative mRNA levels were normalized by Hprt mRNA expression and calculated relative to the mRNA expression seen in the cells transduced with control vector (LV-CONT), set as 1. Data are representative of two independent experiments. **P < 0.01, LV-CONT vs. LV-MYSM1. (d) Quantitative RT-PCR of representative genes in transduced Mysm1−/− B cells. Splenic Mysm1−/− B220+ cells were transduced with indicated recombinant retroviral vectors RV-Pax5 and stimulated with LPS (20 μg/ml). After 4 d stimulation, cells were collected for qRT-PCR. Relative mRNA levels were normalized by Hprt mRNA expression and calculated relative to the mRNA expression seen in the cells transduced with control vector (RV-CONT), set as 1. Data are representative of two independent experiments. **P < 0.01, RV-CONT vs. RV-Pax5. (e) MYSM1 mRNA levels in indicated sorted WT naïve B cells (nB), LPS-activated B cells (aB), and plasma cells (PC) from one of three independent experiments. **P < 0.01, nB vs. PC *P < 0.05, nB vs. aB.
Figure 6
Figure 6. MYSM1 occupies the Pax5 loci in naive B cells.
(a) Schematic diagram of Pax5 gene and its promoter and enhancer region illustrating the positions of the primer pairs used for ChIP assays. (b) ChIP assays of naïve splenic WT B220+ cells (nB, left), LPS-activated WT B220+CD138 cells (aB, middle), and WT CD138+B220 plasma cells (PC, right) using a MYSM1 antibody or control IgG probing for the Pax5 locus. Quantitative PCR was used to analyze the enrichment and the fold enrichments are represented from one of three independent experiments. **p < 0.01, IgG vs. MYSM1.
Figure 7
Figure 7
MYSM1 interacts with the transcription factor PU.1 for recruitment to the Pax5 locus. (a,b) Sequential two-step ChIP assays of naïve splenic WT B220+ cells (a) and WT CD138+B220 plasma cells (b) were performed, showing the recruitment of the endogenous PU.1 and MYSM1 to the Pax5 promoter in naïve WT B cells, but not in WT plasma cells, from one of two independent experiments. The relative binding was defined by determining the immunoprecipitation level (ratio of the amount of immunoprecipitated DNA to that of the input sample) and then comparing to corresponding first ChIP or second ChIP control IgG immunoprecipitation level, which was set as 1.0. **P < 0.01, IgG vs. MYSM1, *P < 0.05, IgG vs. PU.1. (c) Co-immunoprecipitation of PU.1 and MYSM1. Cell lysates from splenic WT B cells transduced with lentivirus containing Mysm1 vector (LV-MYSM1) or control flag vector (LV-Flag) were immunoprecipitated with anti-Flag antibody, then probed with a PU.1 antibody. Five percent of the cell lysate input was loaded. (d) Drastic reduction of PU.1 occupancy at the Pax5 promotion region of naïve Mysm1−/− B cells, compared to that of naïve WT B cells. ChIP data are presented from one of two independent experiments. **P < 0.01, WT vs. Mysm1−/−. (e) Altered histone modifications at the Pax5 locus in splenic Mysm1−/− B cells. ChIP analysis of naïve splenic WT or Mysm1−/− B cells. The DNA precipitated with the indicated antibodies was analyzed by quantitative PCR with primers amplifying the Pax5 promoter region and normalized with input DNA before being compared to WT (set as 1). Data are presented from one of two independent experiments. **P < 0.01, *P < 0.05, WT vs. Mysm1−/−.

Similar articles

Cited by

References

    1. Kouzarides T. Chromatin modifications and their function. Cell 128, 693–705 (2007). - PubMed
    1. Li B., Carey M. & Workman J. L. The role of chromatin during transcription. Cell 128, 707–719 (2007). - PubMed
    1. Jenuwein T. & Allis C. D. Translating the histone code. Science 293, 1074–1080 (2001). - PubMed
    1. Strahl B. D. & Allis C. D. The language of covalent histone modifications. Nature 403, 41–45 (2000). - PubMed
    1. Suganuma T. & Workman J. L. Signals and combinatorial functions of histone modifications. Annu. Rev. Biochem. 80, 473–499 (2011). - PubMed

Publication types

MeSH terms