Characterizing the Switching Thresholds of Magnetophoretic Transistors
- PMID: 26349853
- PMCID: PMC4642725
- DOI: 10.1002/adma.201502352
Characterizing the Switching Thresholds of Magnetophoretic Transistors
Abstract
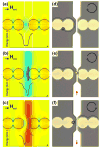
The switching thresholds of magnetophoretic transistors for sorting cells in microfluidic environments are characterized. The transistor operating conditions require short 20-30 mA pulses of electrical current. By demonstrating both attractive and repulsive transistor modes, a single transistor architecture is used to implement the full write cycle for importing and exporting single cells in specified array sites.
Keywords: magnetism; microfabrication; microfluidics; single cells; transistors.
© 2015 WILEY-VCH Verlag GmbH & Co. KGaA, Weinheim.
Figures


Similar articles
-
Characterization of AI-enhanced magnetophoretic transistors operating in a tri-axial magnetic field for on-chip bioparticle sorting.Sci Rep. 2024 Oct 8;14(1):23381. doi: 10.1038/s41598-024-74761-2. Sci Rep. 2024. PMID: 39379453 Free PMC article.
-
Lab-on-a-print: from a single polymer film to three-dimensional integrated microfluidics.Lab Chip. 2009 Apr 21;9(8):1133-7. doi: 10.1039/b816287e. Epub 2009 Jan 21. Lab Chip. 2009. PMID: 19350096
-
Rapid, low-cost and instrument-free CD4+ cell counting for HIV diagnostics in resource-poor settings.Lab Chip. 2014 Aug 7;14(15):2844-51. doi: 10.1039/c4lc00264d. Epub 2014 Jun 9. Lab Chip. 2014. PMID: 24911165
-
Complex three-dimensional microparticles from microfluidic lithography.Electrophoresis. 2020 Sep;41(16-17):1491-1502. doi: 10.1002/elps.201900322. Epub 2020 Feb 12. Electrophoresis. 2020. PMID: 32012294 Review.
-
Microfluidic platforms for lab-on-a-chip applications.Lab Chip. 2007 Sep;7(9):1094-110. doi: 10.1039/b706364b. Epub 2007 Jul 27. Lab Chip. 2007. PMID: 17713606 Review.
Cited by
-
Mattertronics for programmable manipulation and multiplex storage of pseudo-diamagnetic holes and label-free cells.Nat Commun. 2021 May 21;12(1):3024. doi: 10.1038/s41467-021-23251-4. Nat Commun. 2021. PMID: 34021137 Free PMC article.
-
High-throughput precise particle transport at single-particle resolution in a three-dimensional magnetic field for highly sensitive bio-detection.Sci Rep. 2022 Apr 16;12(1):6380. doi: 10.1038/s41598-022-10122-1. Sci Rep. 2022. PMID: 35430583 Free PMC article.
-
Microfluidic Synthesis, Control, and Sensing of Magnetic Nanoparticles: A Review.Micromachines (Basel). 2021 Jun 29;12(7):768. doi: 10.3390/mi12070768. Micromachines (Basel). 2021. PMID: 34210058 Free PMC article. Review.
-
Characterization of AI-enhanced magnetophoretic transistors operating in a tri-axial magnetic field for on-chip bioparticle sorting.Sci Rep. 2024 Oct 8;14(1):23381. doi: 10.1038/s41598-024-74761-2. Sci Rep. 2024. PMID: 39379453 Free PMC article.
-
Magnetophoretic Micro-Distributor for Controlled Clustering of Cells.Adv Sci (Weinh). 2022 Feb;9(6):e2103579. doi: 10.1002/advs.202103579. Epub 2021 Dec 15. Adv Sci (Weinh). 2022. PMID: 34910376 Free PMC article.
References
-
- Mullard A. Nat Rev Drug Discovery. 2011;10:477. - PubMed
Publication types
MeSH terms
Substances
Grants and funding
LinkOut - more resources
Full Text Sources
Other Literature Sources

