

Ideal Cardiovascular Health During Adult Life and Cardiovascular Structure and Function Among the Elderly
- PMID: 26350059
- PMCID: PMC4835821
- DOI: 10.1161/CIRCULATIONAHA.115.017882
Ideal Cardiovascular Health During Adult Life and Cardiovascular Structure and Function Among the Elderly
Abstract
Background: A higher American Heart Association cardiovascular health score (CVHS) predicts a lower incidence of cardiovascular disease (CVD). However, the relationship of CVHS attainment through midlife to late life with CVD prevalence and cardiovascular structure and function in late life is not well described.
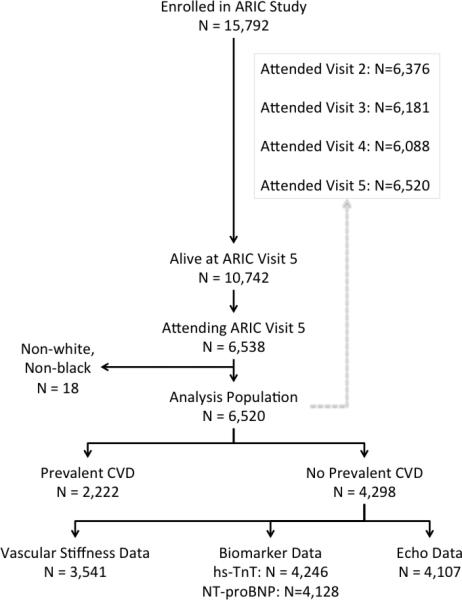
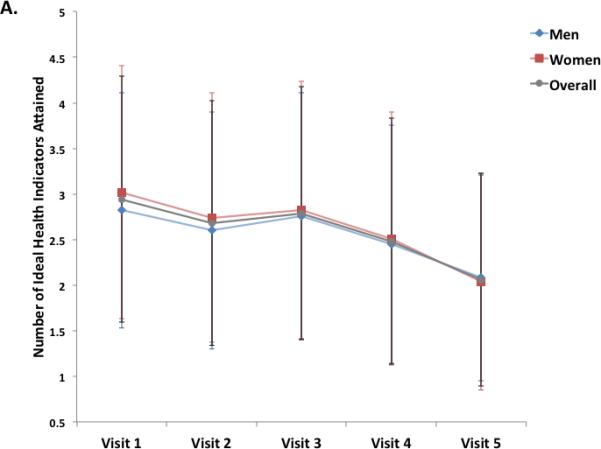
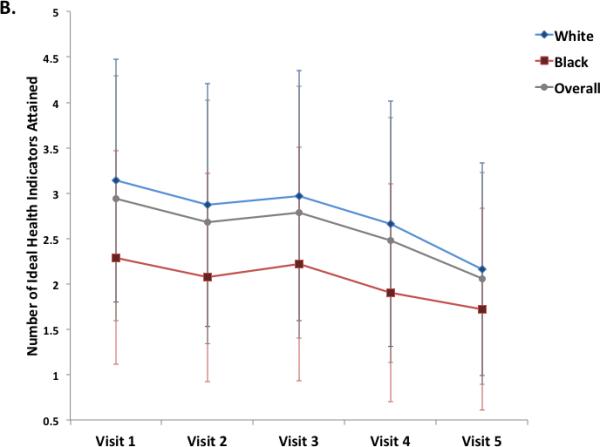
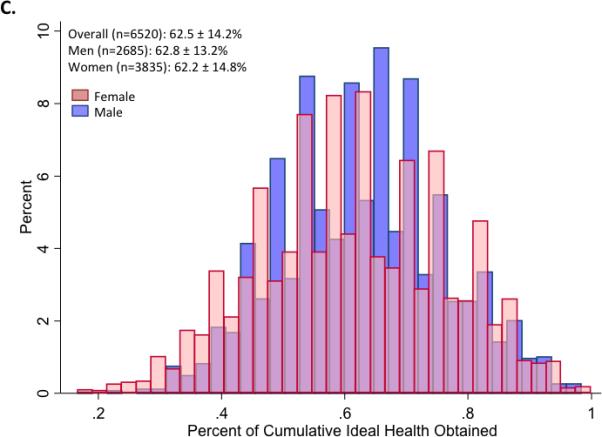
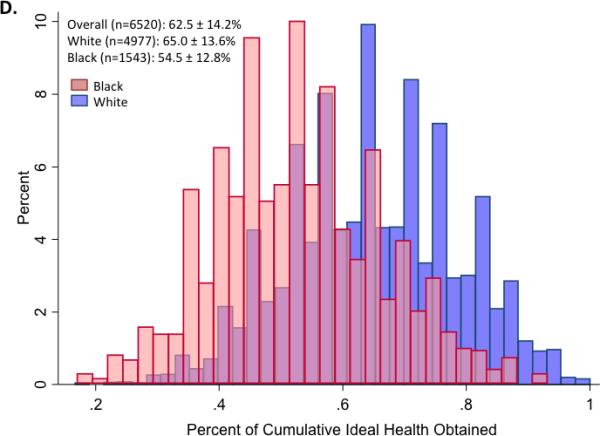
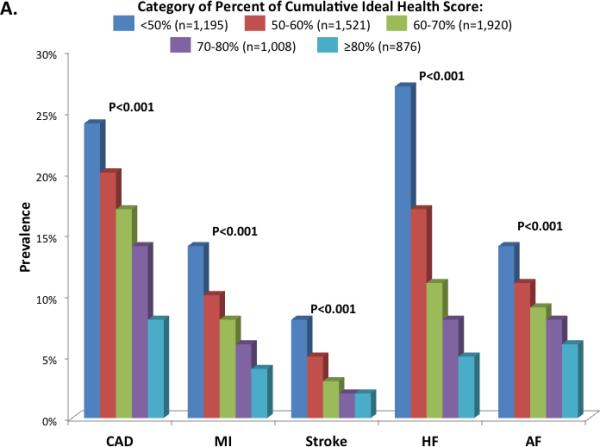
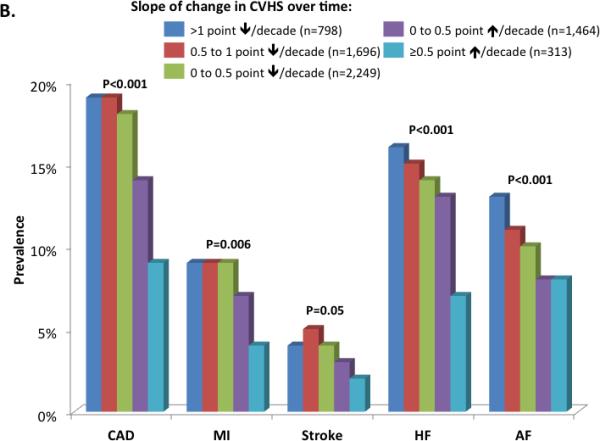
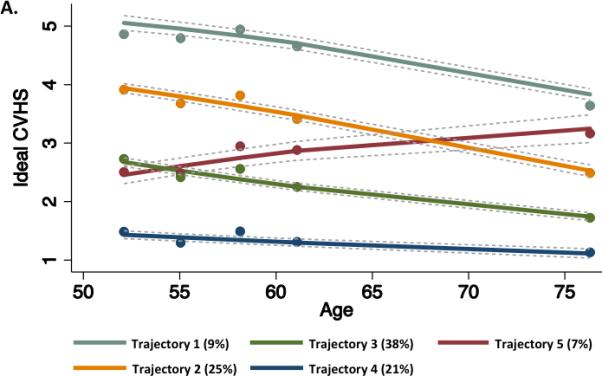
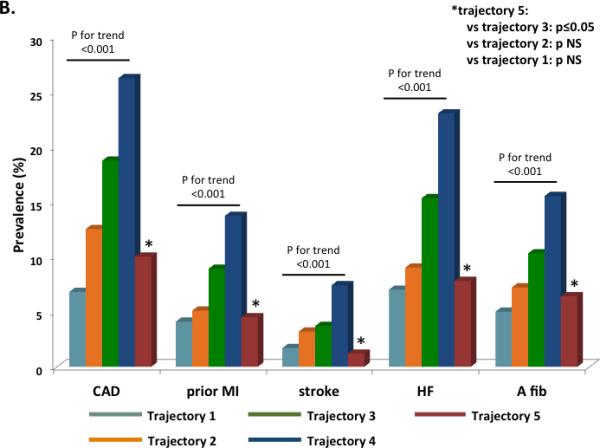
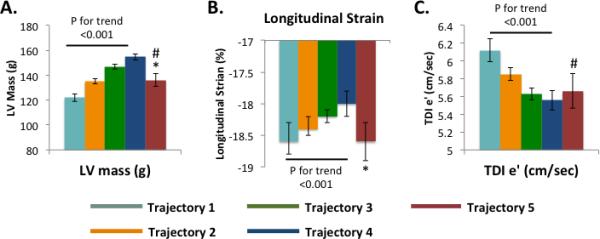
Methods and results: The following 6 ideal cardiovascular health metrics were assessed in the Atherosclerosis Risk in Communities (ARIC) study participants at 5 examination visits between 1987 and 2013: nonsmoking, body mass index <25 kg/m(2), untreated total cholesterol <200 mg/dL, untreated blood pressure <120/<80 mm Hg, fasting blood glucose <100 mg/dL, and ideal physical activity. Attainment over time was assessed as the percentage of maximum possible CVHS metrics achieved at visits 1 through 5, the slope of change in CVHS per decade of follow-up, and CVHS trajectory through follow-up. At visit 5, participant groups were characterized with respect to CVD prevalence (n=6520) and echocardiographic measures of cardiac structure and function (n=5903 free of CVD). CVHS was low at baseline and declined with age. Both greater CVHS attainment and improvement in CVHS during follow-up were associated with a lower prevalence of CVD and better left ventricular structure and systolic and diastolic function at visit 5.
Conclusions: Greater attainment of, and improvements in, ideal cardiovascular health through midlife to late life are associated with lower CVD prevalence and better cardiovascular structure and function when elderly. These findings highlight the importance of consistent primordial and primary prevention efforts throughout midlife to late life as a potential intervention to decrease the burden of CVD among the elderly.
Keywords: aging; cardiovascular diseases; echocardiography; epidemiology; risk factors.
© 2015 American Heart Association, Inc.
Figures
References
-
- Lloyd-Jones DM, Hong Y, Labarthe D, Mozaffarian D, Appel LJ, Van Horn L, Greenlund K, Daniels S, Nichol G, Tomaselli GF, Arnett DK, Fonarow GC, Ho PM, Lauer MS, Masoudi FA, Robertson RM, Roger V, Schwamm LH, Sorlie P, Yancy CW, Rosamond WD. Defining and setting national goals for cardiovascular health promotion and disease reduction: The American Heart Association's strategic impact goal through 2020 and beyond. Circulation. 2010;121:586–613. - PubMed
-
- American Heart Association . Heart disease and stroke statistics – 2009 update. American Heart Association; Dallas, Texas: 2009.
-
- Hunt SA, Abraham WT, Chin MH, Feldman AM Francis GS, Ganiant TG, Jessup M, Konstam MA, Mancini DM, Michl K, Oates JA, Rahko PS, Silver MA, Stevenson LW, Yancy CW. 2009 focus update incorporated into the ACC/AHA 2005 guidelines for the diagnosis and management of heart failure in adults. J Am Coll Cardiol. 2009;53:e1–90. - PubMed
Publication types
MeSH terms
Substances
Grants and funding
- HHSN268201100012C/HL/NHLBI NIH HHS/United States
- K08 HL116792/HL/NHLBI NIH HHS/United States
- HHSN268201100009I/HL/NHLBI NIH HHS/United States
- HHSN268201100010C/HL/NHLBI NIH HHS/United States
- HHSN268201100008C/HL/NHLBI NIH HHS/United States
- HHSN268201100005G/HL/NHLBI NIH HHS/United States
- HHSN268201100008I/HL/NHLBI NIH HHS/United States
- HHSN268201100007C/HL/NHLBI NIH HHS/United States
- HHSN268201100011I/HL/NHLBI NIH HHS/United States
- HHSN268201100011C/HL/NHLBI NIH HHS/United States
- HHSN268201100006C/HL/NHLBI NIH HHS/United States
- HHSN268201100005I/HL/NHLBI NIH HHS/United States
- HHSN268201100009C/HL/NHLBI NIH HHS/United States
- HHSN268201100005C/HL/NHLBI NIH HHS/United States
- HHSN268201100007I/HL/NHLBI NIH HHS/United States
- 1K08HL116792-01A1/HL/NHLBI NIH HHS/United States
LinkOut - more resources
Full Text Sources
Medical
