. 2016 Jun;24(6):924-30.
doi: 10.1038/ejhg.2015.197. Epub 2015 Sep 9.

Phenotypic extremes in rare variant study designs

Affiliations

Phenotypic extremes in rare variant study designs

Gina M Peloso et al. Eur J Hum Genet. 2016 Jun.

Abstract

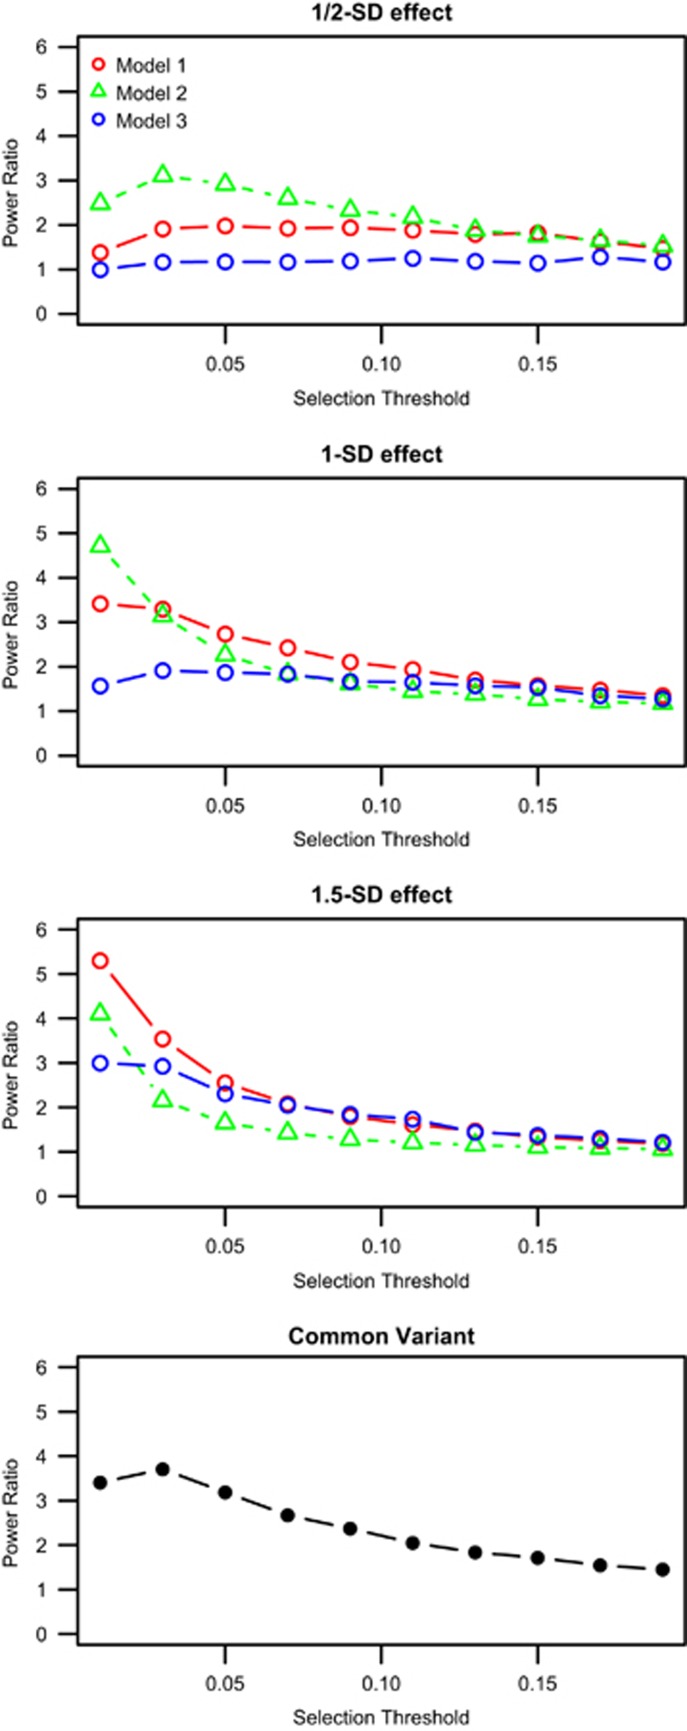
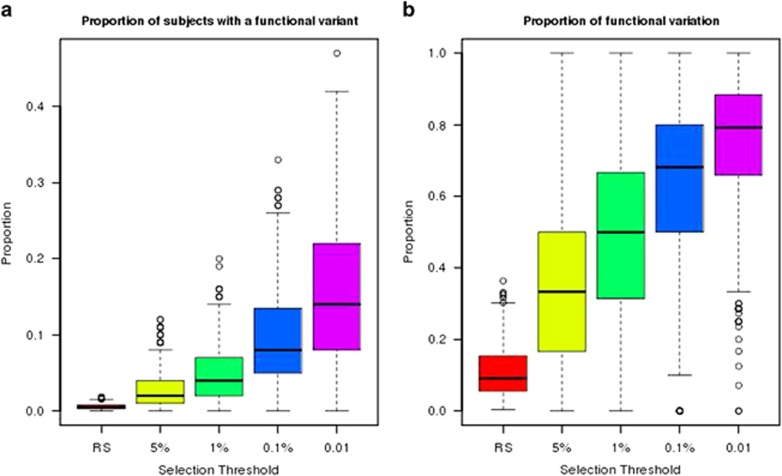
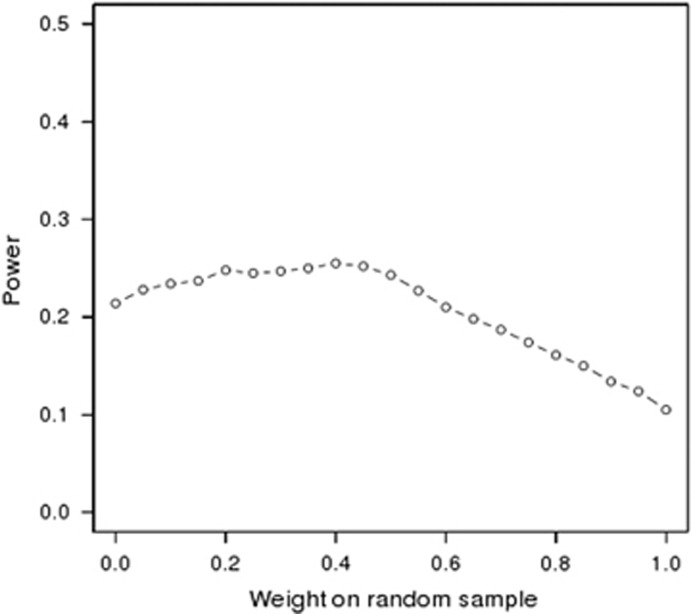
Currently, next-generation sequencing studies aim to identify rare and low-frequency variation that may contribute to disease. For a given effect size, as the allele frequency decreases, the power to detect genes or variants of interest also decreases. Although many methods have been proposed for the analysis of such data, study design and analytic issues still persist in data interpretation. In this study we present sequencing data for ABCA1 that has known rare variants associated with high-density lipoprotein cholesterol (HDL-C). We contrast empirical findings from two study designs: a phenotypic extreme sample and a population-based random sample. We found differing strengths of association with HDL-C across the two study designs (P=0.0006 with n=701 phenotypic extremes vs P=0.03 with n=1600 randomly sampled individuals). To explore this apparent difference in evidence for association, we performed a simulation study focused on the impact of phenotypic selection on power. We demonstrate that the power gain for an extreme phenotypic selection study design is much greater in rare variant studies than for studies of common variants. Our study confirms that studying phenotypic extremes is critical in rare variant studies because it boosts power in two ways: the typical increases from extreme sampling and increasing the proportion of relevant functional variants ascertained and thereby tested for association. Furthermore, we show that when combining statistical evidence through meta-analysis from an extreme-selected sample and a second separate population-based random sample, power is lower when a traditional sample size weighting is used compared with weighting by the noncentrality parameter.


Figures

Figure 1
Figure 1
Ratios of power from the fixed sample size simulation. Samples were simulated with equal numbers for the population-based random sample (RS) and the extreme case–control (CC) sample. The x axis is Threshold, the threshold for selecting the extreme samples. The y axis is the Power Ratio, the ratio of the CC power over the RS power. The first three plots are for the rare variant tests with three different models. The last panel is the power difference for the common variant. The probability that specific class of mutations are function was simulated as follows: Model 1 – prob=0.3, poss=0.05, benign=0.1; model 2 – prob=0.5, poss=0.2, benign=0.05 (increases the amount of variation that is functional); model 3 – prob=0.1, poss=0.01, benign=0.001 (decreases the amount of variation that is functional).
Figure 2
Figure 2
Amount of variation in extremes compared with random sample. (a) Proportion of subjects with a functional variant. (b) Proportion of functional variants. Results are based on 1000 replicates and 1-SD effect for each rare functional variant. RS, random sample of 10 000 individuals.
Figure 3
Figure 3
Power from meta-analysis of a population-based random sample and an extreme-selected sample. Power is based on 1000 replicates and 1-SD effect for each rare functional variant. The extreme-selected sample has a sample size of 400 (200 cases and 200 controls) and the population-based random sample has a sample size of 1000. Power is optimal when the population-based random sample has 40% of the weight and the extreme-selected sample has 60% of the weight. This is in contrast to a sample size weighted meta-analysis that would up-weight the random sample.

Similar articles

Cited by

References

    1. Kiezun A, Garimella K, Do R et al: Exome sequencing and the genetic basis of complex traits. Nat Genet 2012; 44: 623–630. - PMC - PubMed
    1. Kryukov GV, Shpunt A, Stamatoyannopoulos JA, Sunyaev SR: Power of deep, all-exon resequencing for discovery of human trait genes. Proc Natl Acad Sci USA 2009; 106: 3871–3876. - PMC - PubMed
    1. Zuk O, Schaffner SF, Samocha K et al: Searching for missing heritability: designing rare variant association studies. Proc Natl Acad Sci USA 2014; 111: E455–E464. - PMC - PubMed
    1. Do R, Kathiresan S, Abecasis GR: Exome sequencing and complex disease: practical aspects of rare variant association studies. Hum Mol Genet 2012; 21: R1–R9. - PMC - PubMed
    1. Li B, Leal SM: Methods for detecting associations with rare variants for common diseases: application to analysis of sequence data. Am J Hum Genet 2008; 83: 311–321. - PMC - PubMed

Publication types

Substances

LinkOut - more resources