

Using the variability of linkage disequilibrium between subpopulations to infer sweeps and epistatic selection in a diverse panel of chickens
- PMID: 26350629
- PMCID: PMC4806882
- DOI: 10.1038/hdy.2015.81
Using the variability of linkage disequilibrium between subpopulations to infer sweeps and epistatic selection in a diverse panel of chickens
Abstract
A whole-genome scan for identifying selection acting on pairs of linked loci is proposed and implemented. The scan is based on , one of Ohta's 1982 measures of between-population linkage disequilibrium (LD). An approximate empirical null distribution for the statistic is suggested. Although the partitioning of LD into between-population components was originally used to investigate epistatic selection, we demonstrate that values of may also be influenced by single-locus selective sweeps with linkage but no epistasis. The proposed scan is implemented in a diverse panel of chickens including 72 distinct breeds genotyped at 538 298 single-nucleotide polymorphisms. In all, 1723 locus pairs are identified as putatively corresponding to a selective sweep or epistatic selection. These pairs of loci generally cluster to form overlapping or neighboring signals of selection. Known variants that were expected to have been under selection in the panel are identified, as well as an assortment of novel regions that have putatively been under selection in chickens. Notably, a promising pair of genes located 8 MB apart on chromosome 9 are identified based on as demonstrating strong evidence of dispersive epistatic selection between populations.
Figures
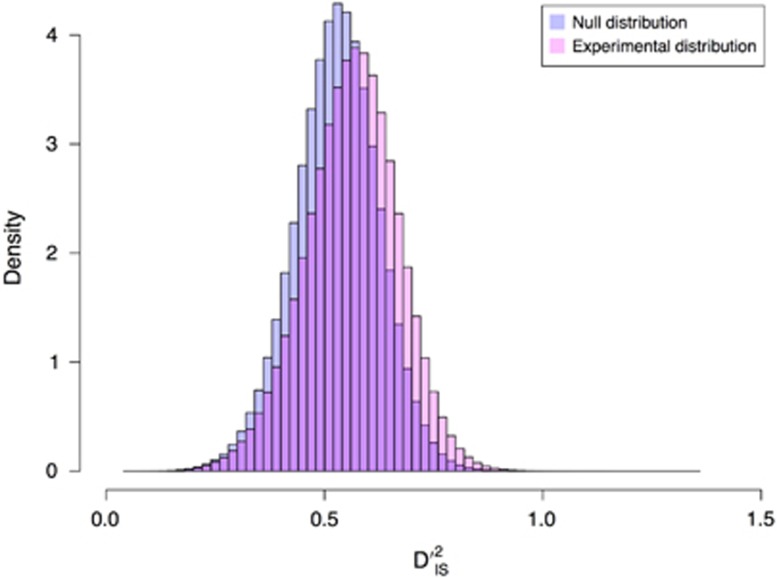
 . Observe that the distributions are quite similar, but the experimental distribution is slightly inflated.
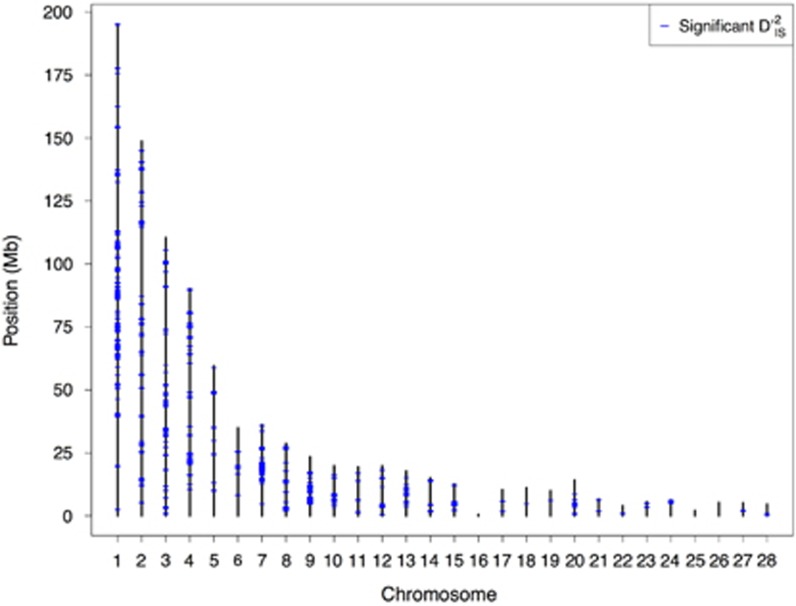
 were identified in the chicken genome. The position of every marker that was part of a significant pair is represented. Positions are plotted according to the galGal4 assembly. These loci are those putatively under dispersive selective sweeps or dispersive cis-acting epistatic selection.
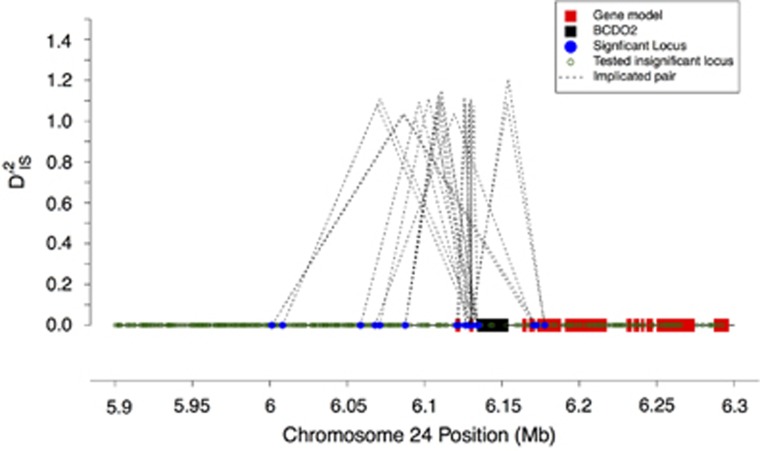
 value observed for each significant pair. The height of each dashed line depicts the value of
  observed for that pair.
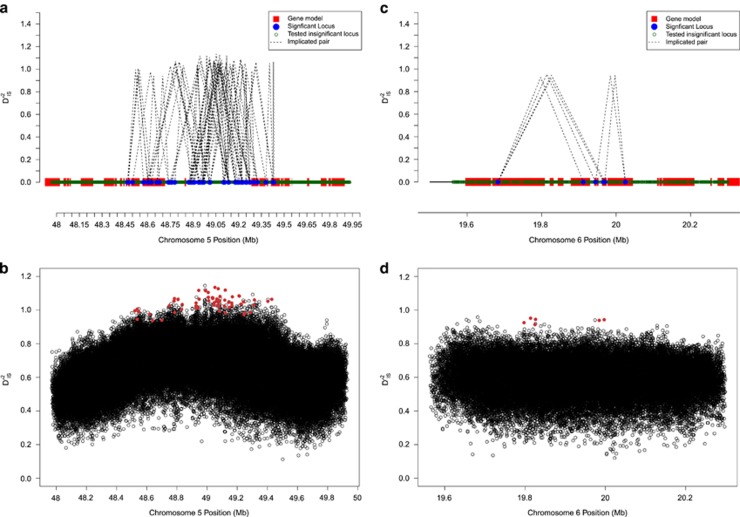
 values for two example regions. a and b demonstrate region on chromosome 5 showing patterns consistent with a large selective sweep. c and d are of a region on chromosome 6, where significance was not clear except for specific locus pairs, suggestive of epistasis. (a) Significant locus pairs identified across a region of chromosome 5; (b)
  for every locus pair across the same region of chromosome 5. Values are plotted at the midpoint of the locus pair. Significant pairs are highlighted in red; (c) Significant locus pairs identified across a region of chromosome 6; (d)
  for every locus pair across the same region of chromosome 6.
Similar articles
-
Genome Scan for Selection in Structured Layer Chicken Populations Exploiting Linkage Disequilibrium Information.PLoS One. 2015 Jul 7;10(7):e0130497. doi: 10.1371/journal.pone.0130497. eCollection 2015. PLoS One. 2015. PMID: 26151449 Free PMC article.
-
Evidence of epistasis in regions of long-range linkage disequilibrium across five complex diseases in the UK Biobank and eMERGE datasets.Am J Hum Genet. 2023 Apr 6;110(4):575-591. doi: 10.1016/j.ajhg.2023.03.007. Am J Hum Genet. 2023. PMID: 37028392 Free PMC article.
-
Detecting short spatial scale local adaptation and epistatic selection in climate-related candidate genes in European beech (Fagus sylvatica) populations.Mol Ecol. 2014 Oct;23(19):4696-708. doi: 10.1111/mec.12902. Epub 2014 Sep 24. Mol Ecol. 2014. PMID: 25156570
-
Statistical genetics in and out of quasi-linkage equilibrium.Rep Prog Phys. 2023 Apr 4;86(5). doi: 10.1088/1361-6633/acc5fa. Rep Prog Phys. 2023. PMID: 36944245 Review.
-
The dynamics of the genotype-phenotype association.Poult Sci. 2003 Jun;82(6):876-81. doi: 10.1093/ps/82.6.876. Poult Sci. 2003. PMID: 12817440 Review.
Cited by
-
Finding Hybrid Incompatibilities Using Genome Sequences from Hybrid Populations.Mol Biol Evol. 2021 Sep 27;38(10):4616-4627. doi: 10.1093/molbev/msab168. Mol Biol Evol. 2021. PMID: 34097068 Free PMC article.
-
Tracing the footprints of a moving hybrid zone under a demographic history of speciation with gene flow.Evol Appl. 2019 Apr 29;13(1):195-209. doi: 10.1111/eva.12795. eCollection 2020 Jan. Evol Appl. 2019. PMID: 31892952 Free PMC article.
-
Large-scale genome-wide SNP analysis reveals the rugged (and ragged) landscape of global ancestry, phylogeny, and demographic history in chicken breeds.J Zhejiang Univ Sci B. 2024 Apr 15;25(4):324-340. doi: 10.1631/jzus.B2300443. J Zhejiang Univ Sci B. 2024. PMID: 38584094 Free PMC article.
-
Screening for epistatic selection signatures: A simulation study.Sci Rep. 2019 Jan 31;9(1):1026. doi: 10.1038/s41598-019-38689-2. Sci Rep. 2019. PMID: 30705409 Free PMC article.
-
MeSH-Informed Enrichment Analysis and MeSH-Guided Semantic Similarity Among Functional Terms and Gene Products in Chicken.G3 (Bethesda). 2016 Aug 9;6(8):2447-53. doi: 10.1534/g3.116.031096. G3 (Bethesda). 2016. PMID: 27261003 Free PMC article.
References
-
- Black WC IV, Krafsur ES. (1985). A FORTRAN program for the calculation and analysis of two-locus linkage disequilibrium coefficients. Theor Appl Genet 70: 491–496. - PubMed
Publication types
MeSH terms
LinkOut - more resources
Full Text Sources
Other Literature Sources
Research Materials
Miscellaneous
