. 2015 Sep 8;6(5):e01155-15.
doi: 10.1128/mBio.01155-15.

Novel Approaches Reveal that Toxoplasma gondii Bradyzoites within Tissue Cysts Are Dynamic and Replicating Entities In Vivo

Affiliations

Novel Approaches Reveal that Toxoplasma gondii Bradyzoites within Tissue Cysts Are Dynamic and Replicating Entities In Vivo

Elizabeth Watts et al. mBio. .

Abstract

Despite their critical role in chronic toxoplasmosis, the biology of Toxoplasma gondii bradyzoites is poorly understood. In an attempt to address this gap, we optimized approaches to purify tissue cysts and analyzed the replicative potential of bradyzoites within these cysts. In order to quantify individual bradyzoites within tissue cysts, we have developed imaging software, BradyCount 1.0, that allows the rapid establishment of bradyzoite burdens within imaged optical sections of purified tissue cysts. While in general larger tissue cysts contain more bradyzoites, their relative "occupancy" was typically lower than that of smaller cysts, resulting in a lower packing density. The packing density permits a direct measure of how bradyzoites develop within cysts, allowing for comparisons across progression of the chronic phase. In order to capture bradyzoite endodyogeny, we exploited the differential intensity of TgIMC3, an inner membrane complex protein that intensely labels newly formed/forming daughters within bradyzoites and decays over time in the absence of further division. To our surprise, we were able to capture not only sporadic and asynchronous division but also synchronous replication of all bradyzoites within mature tissue cysts. Furthermore, the time-dependent decay of TgIMC3 intensity was exploited to gain insights into the temporal patterns of bradyzoite replication in vivo. Despite the fact that bradyzoites are considered replicatively dormant, we find evidence for cyclical, episodic bradyzoite growth within tissue cysts in vivo. These findings directly challenge the prevailing notion of bradyzoites as dormant nonreplicative entities in chronic toxoplasmosis and have implications on our understanding of this enigmatic and clinically important life cycle stage.

Importance: The protozoan Toxoplasma gondii establishes a lifelong chronic infection mediated by the bradyzoite form of the parasite within tissue cysts. Technical challenges have limited even the most basic studies on bradyzoites and the tissue cysts in vivo. Bradyzoites, which are viewed as dormant, poorly replicating or nonreplicating entities, were found to be surprisingly active, exhibiting not only the capacity for growth but also previously unrecognized patterns of replication that point to their being considerably more dynamic than previously imagined. These newly revealed properties force us to reexamine the most basic questions regarding bradyzoite biology and the progression of the chronic phase of toxoplasmosis. By developing new tools and approaches to study the chronic phase at the level of bradyzoites, we expose new avenues to tackle both drug development and a better understanding of events that may lead to reactivated symptomatic disease.


Figures

FIG 1
FIG 1
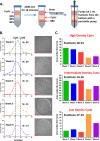
Tissue cyst purification using modified Percoll gradients. (A) Schematic setup of a three-step Percoll gradient containing 90%, 40%, and 20% Percoll overlaid with brain homogenate containing tissue cysts. The tissue cysts resolve between the 90%/40% Percoll interface above the host RBC and below the bulk brain homogenate, which was layered onto the 20% Percoll layer. Tissue cysts are harvested as roughly 1-ml fractions from the bottom of the gradient to the interface between the 20% Percoll and the brain homogenate. (B) Distribution of tissue cysts in the gradients (fractions 10 to 19) relative to the time of harvest postinfection. The bulk of tissue cysts for all times of harvest are of an intermediate density (1.055 and 1.040 mg/ml3). However, the relative proportions of high-density (>1.055 mg/ml3) and low-density (<1.040 mg/ml3) cysts exhibit a shift toward less-dense cysts over time. Nomarski (DIC) images of representative tissue cysts (all between 50 and 52 µm in diameter) exhibit increased loss of demarcation of bradyzoites as a function of the time of infection. (C) The relative distribution of tissue cysts as a function of time of infection represented as the area under the curve for high-density cysts (>1.055 mg/ml3), intermediate-density cysts (1.055 to 1.040 mg/ml3), and low-density cysts (<1.040 mg/ml3) exhibits a time-dependent reduction of high-density tissue cysts and increasing low-density cysts as a function of the time of harvest. These data are a compilation of 99 independent gradients with the number of gradients harvested at each time point indicated in the distribution curves in panel B.
FIG 2
FIG 2
Tissue cyst yields and size distribution during the course of chronic infection. (A) The average tissue cyst yield from 99 independent Percoll gradient purifications was established as described in Materials and Methods. In spite of considerable heterogeneity at each time point, the mean yield (black line) was found to be very similar and not statistically significant (one-way ANOVA, F4,94 = 0.8892 [P = 0.4736], α = 0.05). The mean tissue cyst burden per mouse was established as described in Materials and Methods and in Text S1 in the supplemental material. The actual means and standard deviations are reported in Table 1. (B) Evidence of spontaneous reactivation in the brain of an infected CBA/J mouse harvested 4 weeks postinfection. The enlarged DIC image reveals two tissue cysts and two tachyzoite vacuoles (red arrows). The tissue cysts are evident as Dolichos biflorus agglutinin (DBA) lectin-positive halos and by the patterns of the DNA labeling (small yellow arrows). In contrast, the tachyzoites vacuoles lack a cyst wall, and as a result, they are DBA negative (small red arrows). (C) Distribution of the diameters of tissue cysts harvested 3, 4, 5, 6, and 8 weeks postinfection exhibit considerable heterogeneity at all time points. Statistical analysis by ANOVA reveals diverse level of significance (F4,625 = 6.307; P < 0.0001). The analysis between weeks was done using Tukey’s pairwise multiple-comparison test (α = 0.05). A mean diameter (black line) that differed significantly from another is indicated by the letter Y (for yes), and the level of significance is indicated by the number of asterisks. The letter N (for no) indicates that the two mean diameters being compared did not differ significantly.
FIG 3
FIG 3
Establishing the bradyzoite burden within tissue cysts using BradyCount 1.0. (A) A z-stack of a tissue cyst labeled with Dolichos lectin (DBA) and Hoechst (DNA) spanning the tissue cyst in eight optical sections. The central section (yellow box) was selected, and the diameter (yellow dashed line) was recorded. A DIC image of the specific cyst is adjacent to the fluorescent image. The DNA image is opened in the BradyCount 1.0 application where a screen grab with two panels reveals the DNA image (left) and the Otsu-transformed (thresholded) image (see Materials and Methods) (right). Sliders under the images allow for the adjustment of the thresholding level such that each discrete nucleus is outlined in the right panel. Clicking the count button (red asterisk) counts the nuclear profiles, which correspond directly to the number of bradyzoites. (B) Nuclear (bradyzoite) counts from 463 tissue cysts harvested at all time points plotted against the imaged volume (i.e., the widest optical slice) revealed a general pattern whereby larger tissue cysts tend to harbor more bradyzoites. However, for all size ranges, considerable heterogeneity in bradyzoite (nuclear) numbers are found (magenta box; green and cyan arrows marking the green and cyan boxes in the inset), indicating that tissue cyst size is not an accurate measure of bradyzoite number. Tissue cysts that have vastly different volumes can contain very similar bradyzoite burdens (red asterisks). (C) The mean bradyzoite burden (plus standard error [SE] [error bar]) for tissue cysts harvested at weeks 3 (n = 175), 4 (n = 30), 5 (n = 124), 6 (n = 37), and 8 (n = 97) postinfection reveal evidence for bradyzoite replication between weeks 3 to 6, after which the bradyzoite numbers appear to stabilize.
FIG 4
FIG 4
The packing density as a metric to understand bradyzoite growth with a tissue cyst. The packing density is a ratio of the number of nuclei (bradyzoites) and the volume within which the parasites are housed. This metric can be used to compare the rates of bradyzoite replication and tissue cyst expansion between tissue cysts regardless of their size or time of harvest. (A) This model (model A) posits that the expansion of the tissue cyst is driven by bradyzoite replication. In this scenario, the packing density will not change as a function of cyst volume. In this model, bradyzoite replication and tissue cyst expansion occur proportionately. (B) In this scenario (model B), the expansion of the tissue cyst and bradyzoite replication occur independently of each other, with the replication rate exceeding the rate of cyst expansion. Under this scenario, we would predict an increase in the packing density with increasing cyst volume, which taken to its logical extension will lead to cyst rupture. The likelihood of rupture is determined by the relative rates of bradyzoite replication and cyst expansion. (C) The third scenario (model C) has the rate of cyst expansion outpacing bradyzoite replication, resulting in a volume-dependent reduction in the packing density. Changes in the packing density are possible within a given tissue cyst based on episodes of bradyzoite replication (green bradyzoites). In such instances (red and cyan traces), an increase in bradyzoite number would also proportionately increase the packing density.
FIG 5
FIG 5
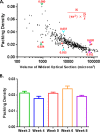
The packing density decreases with increasing cyst volume. (A) The packing density for 463 tissue cysts harvested at all time points plotted relative to the volume of the widest optical section reveals that larger tissue cysts tend to be more loosely packed. These results indicate that the rate of tissue cyst expansion exceeds the replication rate of bradyzoites and occurs independently of bradyzoite replication (scenario C in Fig. 4). The formula used to determine the packing density is shown in red. In this equation, N is the number of nuclei (bradyzoites) in the optical section, D is the diameter of the tissue cyst, z equals the number of optical sections (8 in this case), and πr2 is the area of the circle (r is the radius). Of note, smaller tissue cysts tended to be more densely packed while also exhibiting the greatest range of packing densities (green arrowheads). The differences in packing densities for same/similar sized cysts was observed for the intermediate (cyan arrowheads) and large (magenta arrowheads) cysts as well. Finally, tissue cysts of vastly different volumes can have very similar packing densities (red asterisks). (B) The mean packing densities (plus standard errors of the means [SEM] [error bars]) for tissue cysts harvested at weeks 3 (n = 175), 4 (n = 30), 5 (n = 124), 6 (n = 37), and 8 (n = 97) postinfection reveal evidence of a dynamic and potentially oscillatory pattern where changes in the packing density over the course of the infection reflect the differential rates of cyst expansion and bradyzoite replication. In general, increases in the packing density reflect increased replication rates, while decreases in the packing density are suggestive of tissue cyst expansion in the absence of bradyzoite replication.
FIG 6
FIG 6
Evidence for active endodyogeny within purified tissue cysts. (A) Schematic depiction of endodyogeny, revealing the formation of daughter buds visualized by intense TgIMC3 labeling. The newly formed daughter buds extend within the mother, exhibiting high TgIMC3 intensity as nuclear division results in a bilobe nucleus. Finally, upon the completion of endodyogeny, two new parasites emerge following the degradation and recycling of maternal components. (B) Detection of daughter buds in multiple parasites within a cyst detected with anti-TgIMC3 antibody. One of many such examples is highlighted in the yellow box within the DIC and deconvoluted (Decon) image and magnified to reveal both the TgIMC3 and DNA signals (yellow box). Note that the parasite has a single enlarged nucleus that has not initiated mitosis. (C) Elongation of the daughter buds reveals the outlines of the two progeny parasites (yellow box), with the nucleus revealing a distinct bilobe shape as it migrates into the forming daughter cells. (D) Multiple instances of later stages on endodyogeny (red and yellow boxes) reveal intense TgIMC3 labeling of parasites still connected to the maternal residual body. Note that mitosis in these parasites has been completed as each daughter has a distinct nucleus (red and yellow asterisks). (E) A high proportion of emerging TgIMC3-positive daughter parasites within a tissue cyst. Two highlighted examples (yellow and red boxes) reveal a characteristic “V” pattern in separating daughters still attached to the residual body seen in both the TgIMC3 and DIC images (yellow box; yellow asterisks mark their nuclei). Also seen are two recently divided parasites adjacent to each other exhibiting intense TgIMC3 labeling (red box). All the tissue cysts depicted here were harvested at week 3 postinfection. Additional examples are shown in Fig. S3 in the supplemental material.
FIG 7
FIG 7
Patterns of replication within tissue cysts. (A) The predominant pattern for parasite replication within in vivo tissue cysts was found to be asynchronous. This included isolated growth where individual parasites were actively replicating (top panel) or the more frequent clustered growth (middle and bottom panels) where multiple parasites adjacent to each other were replicating as a group (yellow dotted outline), while other areas within the tissue cyst contained parasites that were not replicating at the time of harvest (red dotted outline). The density of parasite nuclei in areas with active replication was typically higher than those in areas where active replication was not observed (middle and bottom panels; DNA panels). Asynchronous replication was observed well into the chronic phase seen in a week 8 tissue cyst (bottom panel). (B) Moderately (top panel) and highly synchronized (middle and bottom panels) replication where a significant majority or all parasites appeared to be replicating at the same time were detected both early (week 3 [top and middle panels]) and later (bottom panel) time points. Additional examples as well as rare ordered patterns of replication are presented in Fig. S4 in the supplemental material.
FIG 8
FIG 8
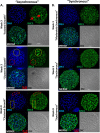
Replicating parasites within tissue cysts are bradyzoites. (A) Tissue cysts containing actively replicating parasites based on the TgIMC3 labeling pattern contain organisms that label with the bradyzoite-specific surface marker TgSRS9, indicating that they are bradyzoites. (B) Parasites within tissue cysts containing actively replicating (based on TgIMC3 labeling) parasites fail to label with the tachyzoite-specific marker TgSAG1. An example of both the highest level of TgSAG1 labeling (top panel) and typical labeling (bottom panel) are shown. The top rows in panels A and B each depict week 3 cysts, while the bottom rows depict week 8 cysts. Additional images of TgSRS9 and TgSAG1 labeling in tissue cysts, including images of immature cysts (based on thin DBA-positive cyst walls) where elevated TgSAG1 intensity is observed are presented in Fig. S5 and S6 in the supplemental material.
FIG 9
FIG 9
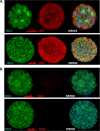
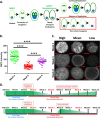
TgIMC3 as a marker to “birth date” bradyzoite replication within tissue cysts. (A) Following an initial round of replication, emergent bradyzoites possess a strong TgIMC3 signal. In the absence of further replication, this signal dissipates with currently unknown kinetics (red boxed profile). In contrast, continued replication resets TgIMC3 intensity levels. (B) Tissue cysts harvested at weeks 3, 5, and 8 were stained at the same time with the same aliquots of TgIMC3 antibody. All images were acquired at random and at a fixed exposure. The mean TgIMC3 pixel fluorescence intensity was normalized to the imaged area of the cyst established. The intensity of TgIMC3 protein expression from 157 cysts (week 3 [n = 60], week 5 [n = 60], week 8 [n = 37]) was analyzed for cysts from three different weeks postinfection. One-way ANOVA demonstrates significant differences for TgIMC3 expression between weeks 3, 5, and 8 (F2,154 = 214.9; P < 0.0001 [indicated by four asterisks]). Tukey’s pairwise multiple-comparison test (α = 0.05) indicated that the mean intensity of TgIMC3 labeling of cysts harvested at each time point differed significantly from one another. The data indicate that tissue cysts harvested at week 3 are brightest, consistent with relatively recent or concurrent replication based on the level of TgIMC3 labeling. Tissue cysts at week 5 exhibit low overall levels of TgIMC3 intensity, while those harvested at week 8 have an intermediate level consistent with significant replication having occurred between weeks 5 and 8. (C) Representative images of tissue cysts defining the high, mean, and low TgIMC3 intensity levels for each population of cysts reveal not only different overall levels of TgIMC3 but also distinct patterns of labeling. (D) Potential models explaining the patterns of TgIMC3 between weeks 3 and 8. Rapid replication during the tachyzoite phase accounts for elevated TgIMC3 labeling that accounts for week 3 labeling exhibiting the brightest cysts with the greatest diversity. A reduction in growth rate, manifesting as greater intervals between replicative events, accounts for the decreased mean TgIMC3 intensity at week 5. The intermediate levels for TgIMC3 at week 8 can be accounted for by two distinct, although nonexclusive, models. In the first model, gradual, likely asynchronous growth results in a net increase in TgIMC3 intensity. Alternatively, a burst of replication within the population (depicted here between weeks 5 and 6), followed by an absence of replication and a time-dependent loss of TgIMC3 intensity, results in intermediate levels within cysts captured at week 8 postinfection.
FIG 10
FIG 10
Relationships between recency of replication, tissue cyst size, and packing density. (A) The relationship between TgIMC3 intensity and tissue cyst size for the cysts harvested at weeks 3, 5, and 8 was plotted. The growth of tissue cysts noted by the shift in the mean tissue cyst diameter (vertical dashed lines; 41 µm at week 3, 58 µm at week 5, and 67 µm at week 8) does not correlate with the recency of parasite replication based on TgIMC3 intensity, emphasizing that parasite replication does not dictate tissue cyst size. Cysts harvested at week 3 exhibit no pattern between TgIMC3 intensity and cyst diameter. This pattern is preserved for week 5 cysts where cyst expansion has occurred, but no significant recent replication is detected. In contrast, tissue cysts harvested at week 8 exhibit an inverse relationship whereby smaller cysts are more likely to contain recently replicated parasites (higher TgIMC3) relative to the larger tissue cysts. (B) The relationship between TgIMC3 intensity (recency of replication) and packing density integrates the bradyzoite burden and tissue cyst size, thereby linking the consequences of both replication and size. Tissue cysts harvested at week 3 or 5 do not exhibit any distinct pattern between TgIMC3 intensity and the packing density with the exception of a significant shift down in the packing density at week 5. This is entirely consistent with the increase in tissue cyst size in the absence of significant replication (low TgIMC3). Notably, replication occurring between weeks 5 and 8 (purple) results in a positive relationship, indicating that the upward shift in the packing density must be related to new replication noted by the intermediate TgIMC3 intensity levels. The mean packing density for the different weeks were as follows: 0.0278 for week 3, 0.0196 for week 5, and 0.0180 for week 8. The imaged cysts used in these analyses are the same as those acquired in Fig. 9B.
FIG 11
FIG 11
Development of bradyzoites within tissue cysts in vivo. All tissue cysts arise from tachyzoites where the high growth rate and synchrony in replication account for a high mean TgIMC3 intensity. Immune pressure contributes to stage conversion noted by the development of the tissue cyst wall (orange). The early transitional bradyzoites exhibit reduced growth rate (noted by the variability in TgIMC3 intensity) relative to tachyzoites while still retaining the capacity for significant replication with a high degree of synchrony within the tissue cyst. The proposed intermediate bradyzoites within a tissue cyst exhibit greater asynchrony in replication depicted by a greater range of TgIMC3 intensities. We hypothesize that the retained replicative potential of both the transitional and intermediate bradyzoite populations contributes to a lower threshold for reactivation. Accordingly, these cysts possess the highest likelihood of both spontaneous reactivation and reactivation in the context of immune suppression. Finally, we hypothesize that progression toward deeper dormancy resulting in the terminal bradyzoite-possessing cysts may have a lower threshold for reactivation within the host but are geared for transmission to the next host. The heterogeneity of replication patterns would still permit a low level of sporadic replication within these terminal tissue cysts. Together, we propose that tissue cysts, while genetically clonal, are physiologically and phenotypically varied with regard to the bradyzoites they house.

Comment in

References

    1. Dubey JP. 1998. Advances in the life cycle of Toxoplasma gondii. Int J Parasitol 28:1019–1024. doi:10.1016/S0020-7519(98)00023-X. - DOI - PubMed
    1. Hill D, Dubey JP. 2002. Toxoplasma gondii: transmission, diagnosis and prevention. Clin Microbiol Infect 8:634–640. doi:10.1046/j.1469-0691.2002.00485.x. - DOI - PubMed
    1. Dubey JP, Lindsay DS, Speer CA. 1998. Structures of Toxoplasma gondii tachyzoites, bradyzoites, and sporozoites and biology and development of tissue cysts. Clin Microbiol Rev 11:267–299. - PMC - PubMed
    1. Dubey JP, Jones JL. 2008. Toxoplasma gondii infection in humans and animals in the United States. Int J Parasitol 38:1257–1278. doi:10.1016/j.ijpara.2008.03.007. - DOI - PubMed
    1. Chew WK, Wah MJ, Ambu S, Segarra I. 2012. Toxoplasma gondii: determination of the onset of chronic infection in mice and the in vitro reactivation of brain cysts. Exp Parasitol 130:22–25. doi:10.1016/j.exppara.2011.10.004. - DOI - PubMed

Publication types