. 2016 Feb 1;213(3):485-95.
doi: 10.1093/infdis/jiv447. Epub 2015 Sep 7.

Excessive Cytolytic Responses Predict Tuberculosis Relapse After Apparently Successful Treatment

Affiliations

Excessive Cytolytic Responses Predict Tuberculosis Relapse After Apparently Successful Treatment

Jacqueline M Cliff et al. J Infect Dis. .

Abstract

Background: Currently, there are no tools to accurately predict tuberculosis relapse. This study aimed to determine whether patients who experience tuberculosis relapse have different immune responses to mycobacteria in vitro than patients who remain cured for 2 years.

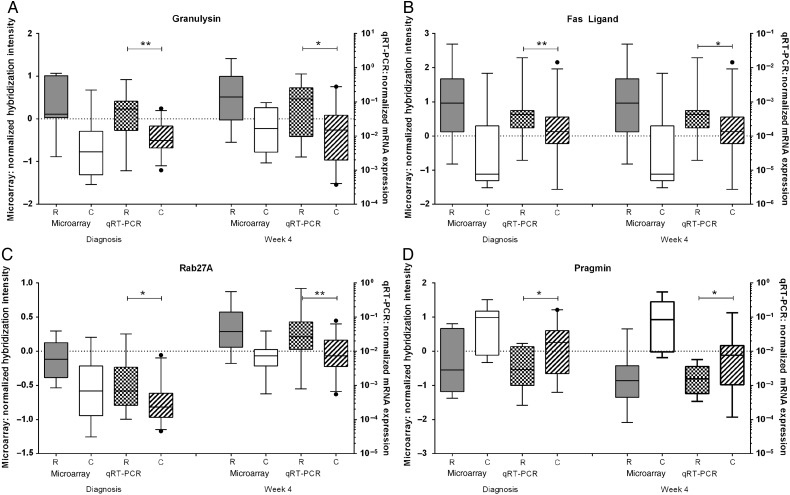
Methods: Patients with an initial episode of pulmonary tuberculosis were recruited in South Africa. Diluted blood, collected at diagnosis and after 2 and 4 weeks of treatment, was cultured with live Mycobacterium tuberculosis for 6 days, and cellular RNA was frozen. Gene expression in samples from 10 patients who subsequently experienced relapse, confirmed by strain genotyping, was compared to that in samples from patients who remained cured, using microarrays.

Results: At diagnosis, expression of 668 genes was significantly different in samples from patients who experienced relapse, compared with expression in patients who remained successfully cured; these differences persisted for at least 4 weeks. Gene ontology and biological pathways analyses revealed significant upregulation of genes involved in cytotoxic cell-mediated killing. Results were confirmed by real-time quantitative reverse-transcription polymerase chain reaction analysis in a wider patient cohort.

Conclusions: These data show that patients who will subsequently experience relapse exhibit altered immune responses, including excessively robust cytolytic responses to M. tuberculosis in vitro, at the time of diagnosis, compared with patients who will achieve durable cure. Together with microbiological and clinical indices, these differences could be exploited in drug development.

Keywords: blood; drug development; microarray; patient; transcriptomics.


Figures

Figure 1.
Figure 1.
Mycobacterium tuberculosis and Mycobacterium bovis bacillus Calmette-Guerin can enhance or suppress gene expression in diluted whole-blood cultures. A, Diluted whole blood from 3 BCG-vaccinated donors was cultured for 6 days alone (control) or in the presence of live M. tuberculosis or M. bovis bacillus Calmette-Guerin. Messenger RNA was extracted and pooled for each condition, prior to hybridization to Affymetrix U133 Plus 2.0 microarrays. Data were normalized against the control sample. The heat map shows 8067 gene entities that were differentially expressed ≥2-fold between at least 2 conditions, following Euclidean complete linkage hierarchically clustering. Gene ontology analysis of the 2293 genes, which were similarly up- or down- regulated by both mycobacteria (B), or the 5774 genes, which showed opposing responses to M. tuberculosis and M. bovis bacillus Calmette-Guerin (C), are shown for gene ontology categories that were significantly overrepresented (P < 5 × 10⁻⁵). All data analysis was conducted in GeneSpring GX.
Figure 2.
Figure 2.
Validation of diluted whole-blood assay results by real-time quantitative reverse-transcription polymerase chain reaction (qRT-PCR) analysis. Real-time qRT-PCR was conducted on samples from 6 BCG-vaccinated donors, independent from the 3 donors used in Figure 1. Results for interferon γ (IFN-γ; A), interleukin 32 (IL-32) (B), interferon gamma-inducible protein 30 IFI30 (D), and acid phosphatase 2 (ACP2; D) are shown as the number of transcript copies of the gene of interest divided by the geometric mean number of copies of the 3 housekeeping genes cyclophilin A, HuP0, and TBP, within each sample. Bars show the mean and standard error of the mean. Microarray data are shown for comparison. *P < .05 and **P < .01, by the Mann–Whitney U test. Abbreviation: CON, control.
Figure 3.
Figure 3.
Blood gene expression patterns are consistent over 4 weeks of tuberculosis treatment and can be used to classify patient outcome. A, Expression patterns of genes differentially expressed between tuberculosis-relapse and cured groups in Mycobacterium tuberculosis–stimulated diluted whole-blood cultures over the first 4 weeks of tuberculosis treatment. The normalized hybridization intensity of expression of 381 genes found to be ≥2-fold differentially expressed (P < .05, with Benjamini–Hochberg false-discovery rate correction) at at least one time point is shown for the mean of each patient group at the indicated time points. Genes have been hierarchically clustered using a Euclidean algorithm in GeneSpring GX. B, Hierarchical clustering was performed, using a Euclidean similarity measure and centroid linkage rule, for both patients and genes, using the 309 genes that were on average ≥2-fold differentially expressed between tuberculosis-relapse and cured groups in diluted whole-blood samples collected after 4 weeks of treatment, following stimulation in vitro with live M. tuberculosis. The table shows the treatment outcome (C = cure and R = relapse), the disease severity at diagnosis (M = moderate or S = severe, based on chest radiography findings), the 2-month sputum smear result, and the ratio of lymphocytes to monocytes in blood at the time of tuberculosis diagnosis for each patient. C, Principal component analysis was performed for samples from the 10 patients with relapse and the 10 cured patients at the 3 time points, using the 18 genes that were highly significantly ≥2-fold differentially expressed, using the Bonferroni familywise error rate correction (Supplementary Table 4). D, Molecular signatures were derived for each sample by summing the normalized log2-transformed hybridization intensity data for the 8 genes that were upregulated in the cured group and the 10 genes that were upregulated in the tuberculosis-relapse group, according to analysis of variance (Table 2). Receiver operating characteristic curve analyses were conducted to determine the accuracy of the molecular signatures, to determine treatment outcome. In the treatment-relapse group, 9 had data at diagnosis, 8 had data from week 2, and 10 had data from week 4. In the cured group, 10 had data at all time points. Abbreviation: AUC, area under the curve.
Figure 4.
Figure 4.
Gene ontology (GO) analysis of 668-gene entities differentially expressed between the cured group and the tuberculosis-relapse group. A, GO analysis of the 668 gene entity list from the analysis of variance (Supplementary Table 2) was conducted in GeneSpring GX to grossly allocate function to the gene list. Biological processes are shown where they are overrepresented within the 668 gene entity list (P < .1). B, The same gene list was inputted into the Database for Annotation, Visualization, and Integrated Discovery (DAVID) functional annotation tool. A total of 506 entities were mapped to unique known genes in the DAVID database, and 23 biological process GO terms, containing ≥15 entities and with an EASE score of <0.05, were identified within the gene entity list. GO terms are shown clustered by function. Fold–enrichment values, showing overrepresentation of the term within the 506 gene list, are plotted as bars on the top axis; values calculated on the basis of 1 – [EASE score] are plotted as dots on the bottom axis.
Figure 5.
Figure 5.
Validation of microarray results by real-time quantitative reverse-transcription polymerase chain reaction (qRT-PCR). The expression of granulysin (A), fas ligand (B), rab27A (C), perforin (D), and pragmin (E) were measured by qRT-PCR in diluted whole-blood cultures stimulated for 6 days with live Mycobacterium tuberculosis H37Rv at the time of tuberculosis diagnosis and after 4 weeks of treatment. Data are for 11 patients in the tuberculosis-relapse group (2 with moderate and 9 with severe disease at the time of tuberculosis diagnosis) and for 27 patients in the cured group (6 with moderate and 21 with severe disease at the time of tuberculosis diagnosis). Data are as the number of copies of the gene of interest normalized against the geometric mean number of copies of HuP0, HPRT, and TBP. The box plots show the 25–75th percentile for the data set, with the line denoting the median, the whiskers showing the 5th–95th percentiles, and the dots showing the outliers. *P < .05 and **P < .01, by the Mann–Whitney U test. Abbreviation: mRNA, messenger RNA.

References

    1. Jindani A, Nunn AJ, Enarson DA. Two 8-month regimens of chemotherapy for treatment of newly diagnosed pulmonary tuberculosis: international multicentre randomised trial. Lancet 2004; 364:1244–51. - PubMed
    1. Marx FM, Dunbar R, Enarson DA et al. . The temporal dynamics of relapse and reinfection tuberculosis after successful treatment: a retrospective cohort study. Clin Infect Dis 2014; 58:1676–83. - PubMed
    1. Wallis RS, Wang C, Doherty TM et al. . Biomarkers for tuberculosis disease activity, cure, and relapse. Lancet Infect Dis 2010; 10:68–9. - PubMed
    1. Hesseling AC, Walzl G, Enarson DA et al. . Baseline sputum time to detection predicts month two culture conversion and relapse in non-HIV-infected patients. Int J Tuberc Lung Dis 2010; 14:560–70. - PubMed
    1. Berry MP, Graham CM, McNab FW et al. . An interferon-inducible neutrophil-driven blood transcriptional signature in human tuberculosis. Nature 2010; 466:973–7. - PMC - PubMed

Publication types