

The epigenetic signature of subcutaneous fat cells is linked to altered expression of genes implicated in lipid metabolism in obese women
- PMID: 26351548
- PMCID: PMC4562340
- DOI: 10.1186/s13148-015-0126-9
The epigenetic signature of subcutaneous fat cells is linked to altered expression of genes implicated in lipid metabolism in obese women
Abstract
Background: Obesity is associated with changes in fat cell gene expression and metabolism. What drives these changes is not well understood. We aimed to explore fat cell epigenetics, i.e., DNA methylation, as one mediator of gene regulation, in obese women. The global DNA methylome for abdominal subcutaneous fat cells was compared between 15 obese case (BMI 41.4 ± 4.4 kg/m(2), mean ± SD) and 14 never-obese control women (BMI 25.2 ± 2.5 kg/m(2)). Global array-based transcriptome analysis was analyzed for subcutaneous white adipose tissue (WAT) from 11 obese and 9 never-obese women. Limma was used for statistical analysis.
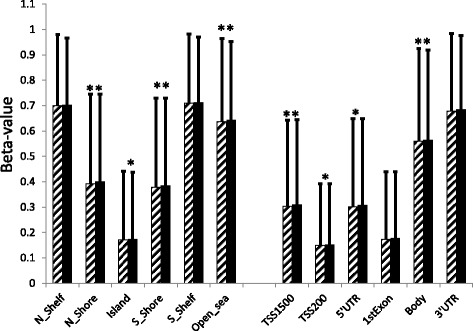
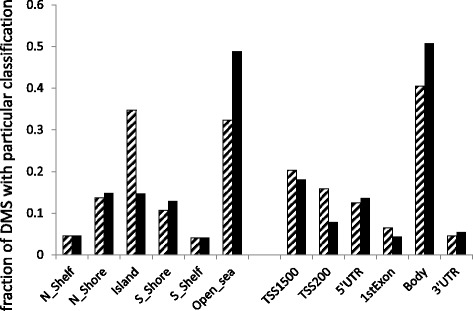
Results: We identified 5529 differentially methylated DNA sites (DMS) for 2223 differentially expressed genes between obese cases and never-obese controls (false discovery rate <5 %). The 5529 DMS displayed a median difference in beta value of 0.09 (range 0.01 to 0.40) between groups. DMS were under-represented in CpG islands and in promoter regions, and over-represented in open sea-regions and gene bodies. The 2223 differentially expressed genes with DMS were over-represented in key fat cell pathways: 31 of 130 (25 %) genes linked to "adipogenesis" (adjusted P = 1.66 × 10(-11)), 31 of 163 (19 %) genes linked to "insulin signaling" (adjusted P = 1.91 × 10(-9)), and 18 of 67 (27 %) of genes linked to "lipolysis" (P = 6.1 × 10(-5)). In most cases, gene expression and DMS displayed reciprocal changes in obese women. Furthermore, among 99 candidate genes in genetic loci associated with body fat distribution in genome-wide association studies (GWAS); 22 genes displayed differential expression accompanied by DMS in obese versus never-obese women (P = 0.0002), supporting the notion that a significant proportion of gene loci linked to fat distribution are epigenetically regulated.
Conclusions: Subcutaneous WAT from obese women is characterized by congruent changes in DNA methylation and expression of genes linked to generation, distribution, and metabolic function of fat cells. These alterations may contribute to obesity-associated metabolic disturbances such as insulin resistance in women.
Keywords: Adipocytes; Adipogenesis; Epigenetics; Lipolysis.
Figures
References
LinkOut - more resources
Full Text Sources
Other Literature Sources
Molecular Biology Databases
